


Agriculture remains one of the most dangerous occupations in the United States, a reality that plays out every year across farms, ranches, and rural communities where heavy machinery, vehicles, livestock, and environmental hazards converge. Thousands of injuries and hundreds of fatalities are attributed to agricultural work annually, yet the information needed to understand and prevent these incidents has long been scattered, difficult to access, and hard to interpret. A research team at the University of Illinois Urbana-Champaign has now built a tool designed to change that, offering an interactive platform through which educators, researchers, and safety professionals can retrieve customized information about agricultural injuries with just a few clicks.
The project, described in a new article in the Journal of Agromedicine, began with a practical goal: giving Extension educators a way to learn more about agricultural injuries in their own communities and to compare patterns across different regions. Salah Issa, an Illinois Extension specialist and associate professor in the Department of Agricultural and Biological Engineering, part of the College of Agricultural, Consumer and Environmental Sciences and The Grainger College of Engineering, explained that the team eventually broadened the scope to include search options tailored to researchers, whose data demands differ considerably from those of frontline educators.
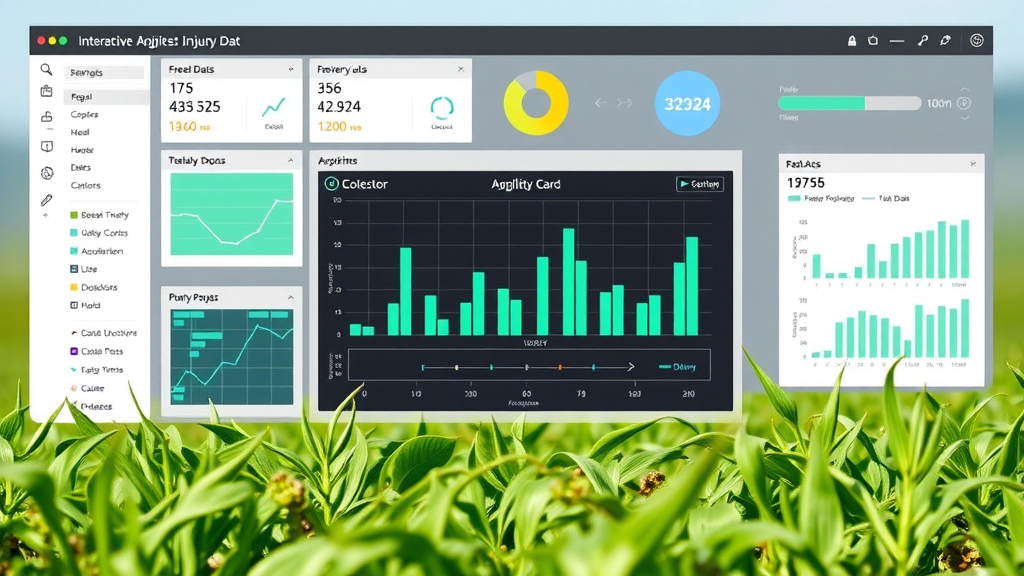
The result is the Agricultural Injury Dashboard, a web-based platform covering agricultural injuries in five Midwestern states: Iowa, Illinois, Michigan, Minnesota, and Wisconsin. The dashboard contains tracks for researchers and educators to customize their queries according to specific purposes, allowing users to search across a variety of parameters and view the results as interactive graphs and charts. Rather than presenting static tables or downloadable spreadsheets, the platform responds dynamically to user input, making it possible to explore the underlying data from multiple angles without any specialized analytical training.
Lead author Sihan Li, who helped develop the dashboard as a doctoral student in Agricultural and Biological Engineering and now continues the work as a visiting Extension outreach associate, emphasized the interactivity at the heart of the design. Everything on the platform responds to selection: clicking on a given year and a certain type of injury causes every chart to highlight that specific injury type and display its associated age, gender, and fatality distribution. Because the charts work in tandem, users can progressively hone in on the data according to their needs, narrowing from broad regional trends down to the specific demographic and circumstantial details of particular incident categories.
The development process began with a systematic review of existing sources where users could look up agricultural injury information. The researchers found that these resources were not very user-friendly, a shortcoming that limited their usefulness for the very audiences—educators, safety specialists, and community planners—who most needed timely and accessible data. The team set out to build something functional, efficient, and easy to use, and they refined the design through pilot testing with different user groups, incorporating feedback at each stage to improve navigation, clarity, and the relevance of the available filters.
To populate the dashboard, the researchers drew on the AgInjuryNews database, a resource that categorizes agricultural injuries reported in news coverage across the United States and Canada. For the initial release, they included AgInjuryNews data from the five Midwestern states spanning 2016 to 2024. The dataset provides rich contextual information for each incident, including the cause and type of injury, the location, the time of occurrence, and victim demographics such as age and gender. In addition, each record carries classification codes from the Occupational Injury and Illness Classification System, known as OIICS, and the Farm and Agricultural Injury Classification, or FAIC, giving the platform a standardized structure that supports rigorous comparison across years, states, and injury categories.
Li and Issa built the interactive dashboard using Microsoft Power BI, a business analytics platform that provides a wide range of data visualization capabilities. The choice allowed the team to link multiple visualizations so that they update in concert, a technical feature that underpins the dashboard’s ability to highlight selected injury types across every chart simultaneously. The partnership with AgInjuryNews supplied the initial data foundation, but the researchers plan for future updates to be populated by their own data collection efforts, giving the University of Illinois team direct control over the quality and timeliness of the records feeding the platform.
That in-house data operation is already substantial. According to Issa, the University of Illinois database for agricultural injuries is based on news clippings, and the team also asks the Illinois Department of Public Health to review the compiled information so that any missing cases can be added. He described the resulting dataset as probably one of the best available for fatal agricultural injuries in the state. While this means the dashboard will be primarily focused on Illinois going forward, Issa noted that users from other states should find it easy to adapt the platform to their own purposes by adding their own datasets, an approach that could extend the tool’s benefits well beyond the Midwest.
The researchers argue that access to a resource providing an overview of agricultural injuries is essential to education and prevention. Because accidents, especially fatal ones, happen rarely enough within any single community that patterns may go unnoticed, Issa stressed the importance of staying abreast of what is happening across the wider region. When trends of incidents become visible across multiple communities, Extension services and safety organizations can launch targeted programs to educate farmers and address emerging hazards before they grow into larger problems. In this way, the dashboard functions not merely as a record of past events but as an early-warning system that transforms scattered incident reports into actionable regional intelligence.
Looking ahead, the team hopes to expand the dashboard so that it captures not just the occurrence of accidents but also their monetary and human impact on communities, adding an economic and social dimension to the existing injury data. The research article, titled “Design of an Interactive Agricultural Injury Dashboard: Enhancing Data Visualization and Stakeholder Engagement Using AgInjuryNews Data,” is published in the Journal of Agromedicine. The project was partially supported by the Centers for Disease Control and Prevention’s National Institute for Occupational Safety and Health, with additional research support provided through the Hatch Act of 1887 from the U.S. Department of Agriculture’s National Institute of Food and Agriculture. The work also credits AgInjuryNews.org for providing access to the agricultural injury data on which the platform’s initial dataset was built, a collaboration that illustrates how open data resources and university research teams can combine to produce tools with immediate practical value for rural safety.
Subject of Research: Development of an interactive dashboard for visualizing and analyzing agricultural injury data to support safety education and prevention.
Article Title: U of I researchers develop interactive tool to track agricultural injuries, strengthen prevention efforts
Article References: U of I researchers develop interactive tool to track agricultural injuries, strengthen prevention efforts. (n.d.). Original publication
Image Credits: AI Generated
DOI: Not provided
Keywords: agricultural safety, agricultural injuries, data visualization, University of Illinois, AgInjuryNews, Extension education, farm fatalities, Power BI, Journal of Agromedicine, injury prevention, Midwest agriculture, occupational safety
Cite Scienmag News
Alan Morgan. (September 22, 2026). Interactive Dashboard Puts Agricultural Injury Data in the Hands of Educators and Researchers. Scienmag. https://scienmag.com/interactive-dashboard-puts-agricultural-injury-data-in-the-hands-of-educators-and-researchers/
Alan Morgan. "Interactive Dashboard Puts Agricultural Injury Data in the Hands of Educators and Researchers." Scienmag, 22 September 2026, https://scienmag.com/interactive-dashboard-puts-agricultural-injury-data-in-the-hands-of-educators-and-researchers/. Accessed 22 September 2026.
Alan Morgan. "Interactive Dashboard Puts Agricultural Injury Data in the Hands of Educators and Researchers." Scienmag. September 22, 2026. https://scienmag.com/interactive-dashboard-puts-agricultural-injury-data-in-the-hands-of-educators-and-researchers/


