


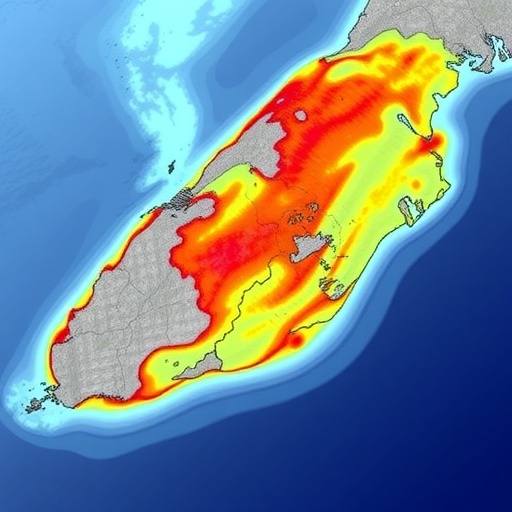
When devastating floods swept across South Africa’s Western Cape in late September 2023, the destruction was so severe that the government declared a national disaster. At least eleven people died, more than 15,000 homes lost power, and damages exceeded 595 million rand. Major transport routes including the N1 highway and Franschhoek Pass were closed, rooftop rescues were carried out in the town of Greyton, and emergency evacuations followed along the Klein River. Now, a new study published in the journal Natural Hazards has traced an unexpected thread through the disaster: the temperature of the Agulhas Current, the warm ocean stream flowing along South Africa’s southeastern coast, helped determine just how bad the flooding became.
The heritage day floods of 23 to 26 September 2023 were triggered by a cut-off low, a cold-cored low-pressure system that detaches from the upper-level westerly jet stream and can linger quasi-stationarily over a region for days. That persistence is precisely what makes cut-off lows so dangerous for the Western Cape: prolonged rainfall accumulates over the same catchments, saturating soils and pushing rivers over their banks. But the storm itself was only part of the story. Cut-off lows need moisture, and that moisture largely comes from the ocean below. Warm sea-surface temperatures over the Agulhas Current System enhance latent heat fluxes, feeding atmospheric instability and intensifying rainfall when uplift mechanisms are present. The new study, led by Chelsey L. Jansen of the University of Cape Town together with Babatunde J. Abiodun, Akintunde I. Makinde, and Sabina Abba Omar, set out to quantify how much this oceanic amplifier actually shaped the flood’s severity on the ground.
To do this, the team built a two-dimensional hydraulic model of the Theewaterskloof Dam, Cape Town’s largest reservoir and a linchpin of the regional water supply. Completed in 1979 near Villiersdorp, the dam holds roughly 480 million cubic metres of water across a surface area of about 48 square kilometres and forms a key node in the Riviersonderend–Berg River transfer scheme. During the flood it reached 109 percent of capacity, submerging surrounding estates and discharging excess water through its sluices and spillways. Similar emergency releases from the Voëlvlei and Bellair dams sent large volumes into downstream rivers, triggering flash floods and damaging bridges in agricultural valleys. The researchers used the Hydrologic Engineering Center River Analysis System, HEC-RAS version 6.6, which solves the depth-averaged Saint–Venant shallow-water equations over a computational mesh, capturing mass conservation, diffusion-wave momentum balance, and Manning’s friction formulation across the floodplain.
The model’s geometry was constructed from a 12.5-metre-resolution digital elevation model derived from Japanese ALOS PALSAR remote sensing data, land-cover classifications from the MODIS MCD12Q1 product at approximately 500-metre resolution, and the FAO–UNESCO digital soil map, which identified sandy loam as the single dominant soil type across the domain. Land-cover classes informed spatially varying Manning’s roughness coefficients and imperviousness estimates, while the soil and land-cover data were combined through the Soil Conservation Service Curve Number method to represent direct runoff generation. The computational mesh combined structured and unstructured cells, with stream-aligned cells at 100-metre resolution, perimeter cells at 500 metres, and a 250-metre refinement zone covering the reservoir itself.
A critical challenge was choosing what would drive the model. The team ran five experiments. In the first, precipitation observations from two Department of Water and Sanitation gauges forced the model using the rain-on-grid method, which applies rainfall directly across the computational domain rather than only at channel boundaries. In the second and third experiments, the model was driven respectively by precipitation and streamflow from the South Africa Flood and Drought Monitor, a 5-kilometre-resolution system developed by the Princeton Climate Institute, the University of Southampton, and Princeton University that blends satellite products, ground observations, and the Variable Infiltration Capacity hydrological model, with runoff routed through the RAPID model. The final two experiments used precipitation from the Model for Prediction Across Scales-Atmosphere, or MPAS, a variable-resolution global climate model configured with a 60-to-15-kilometre mesh that concentrates fine resolution over the Western Cape to resolve mesoscale storm dynamics.
When the team compared simulated flood extents against satellite observations from the Copernicus Sentinel-2 mission, using a normalized difference flood index computed from the red and shortwave-infrared bands to delineate open water and saturated soils, the results were strikingly consistent. Regardless of which observational dataset forced the model, HEC-RAS reproduced the flood footprint near the dam with spatial correlations between roughly 0.78 and 0.81. Even the MPAS-driven simulations performed comparably, achieving correlations near 0.79 without amplifying uncertainty beyond observational bounds. The SAFFDM dataset tracked the timing of rainfall events well, correlating at about 0.90 with gauge records, though it underestimated the 15-day accumulated total by more than 53 millimetres, while MPAS underestimated it by only about 18 millimetres. These results demonstrate that a coupled modelling chain, from atmospheric simulation through hydrodynamic routing, can deliver skillful flood forecasts even in a data-scarce region where continuous in-situ streamflow observations were unavailable during the event.
Yet the simulations also exposed the limits of the approach. Cross-section analyses revealed that the model consistently placed flood boundaries near a single altitude of about 347 metres, whereas the observed inundation occurred across a range of roughly 344 to 348 metres depending on location. In one cross-section the model overestimated flooding, and in another it underestimated it, purely because of vertical errors of one to a few metres in the global elevation dataset interacting with low-gradient terrain. Errors also grew when the evaluation domain was narrowed: simulation bias was under 4 percent across the larger region but exceeded 20 percent in a smaller, more vulnerable zone near the dam containing residential and recreational properties. The researchers point to high-resolution LiDAR terrain data and multi-source satellite observations, including synthetic aperture radar flood mapping, as the path forward for reducing these local biases.
The centrepiece of the study, however, was the sensitivity experiment on the ocean. The team ran two sets of MPAS simulations, each with eleven ensemble members generated by perturbing the 500-hectopascal temperature field in increments of 0.1 degrees Celsius to capture internal atmospheric variability. In the control experiment, sea-surface temperatures reflected observed conditions, with the warm Agulhas Current supplying moisture to the storm. In the second experiment, sea-surface temperatures over the Agulhas Current System were artificially reduced. The precipitation record showed what that change meant physically: the cooling preserved the overall rainfall pattern but cut the peak daily rainfall on 24 September from roughly 65 millimetres to about 48 millimetres.
Feeding these two precipitation sets into HEC-RAS revealed a physically consistent chain of consequences. Cooling the Agulhas Current slightly shrank the spatial flood extent, with reductions of 1.7 percent in one analysis region and 2.5 percent in the other, equivalent to about 2,971 and 268 square metres respectively. Inundation onset was delayed, and, most significantly, peak flood depth dropped markedly compared with the control. The overall character of the flood remained similar, but the ocean’s thermal state demonstrably modulated how much water fell, how quickly it arrived, and how deeply it pooled on the floodplain. The finding provides mechanistic evidence for a pathway long suspected in the literature: elevated sea-surface temperatures over the Agulhas Current intensify rainfall from cut-off lows, and that intensification translates directly into more severe inland flooding.
The implications reach well beyond a single storm. Long-term analyses show the Agulhas Current has been warming since the 1980s, and recent work suggests intensifying eddy activity within the current is amplifying vertical temperature contrasts and coastal climate extremes. If a warmer Agulhas Current loads the dice for heavier cut-off low rainfall, then ocean monitoring becomes an integral part of flood preparedness for the Western Cape, not a peripheral concern. The authors are careful to note that the current cools and warms through natural processes, including eddy activity, wind variability, and surface heat fluxes, and that deliberately engineering its temperature, through artificial upwelling or geoengineering schemes, would carry severe ecological and ethical risks. Instead, they argue, policy should prioritise investment in high-resolution terrain data, multi-source satellite monitoring, and coupled atmosphere–ocean modelling that can anticipate flood risks more accurately and fold natural ocean variability into hazard assessments.
For a province that must simultaneously manage chronic water scarcity and catastrophic floods, the study offers a sober lesson in complexity. The same reservoir that stores winter runoff for millions of Capetonians can, when nearly full, become an amplifier of downstream disaster through emergency releases. The same warm current that sustains the region’s marine ecosystems and moderates its climate can, under the right synoptic conditions, supercharge a storm. Understanding and monitoring those ocean–atmosphere connections, the researchers conclude, is essential for early warning systems, reservoir operation, and climate adaptation strategies in regulated catchments, not only in South Africa but anywhere that warm western boundary currents meet landfalling storms.
Cite Scienmag News
Violet Maxwell. (September 10, 2026). Agulhas Current’s cooling effect on Cape Town’s Theewaterskloof flood event modeled. Scienmag. https://scienmag.com/agulhas-currents-cooling-effect-on-cape-towns-theewaterskloof-flood-event-modeled/
Violet Maxwell. "Agulhas Current’s cooling effect on Cape Town’s Theewaterskloof flood event modeled." Scienmag, 10 September 2026, https://scienmag.com/agulhas-currents-cooling-effect-on-cape-towns-theewaterskloof-flood-event-modeled/. Accessed 10 September 2026.
Violet Maxwell. "Agulhas Current’s cooling effect on Cape Town’s Theewaterskloof flood event modeled." Scienmag. September 10, 2026. https://scienmag.com/agulhas-currents-cooling-effect-on-cape-towns-theewaterskloof-flood-event-modeled/


