


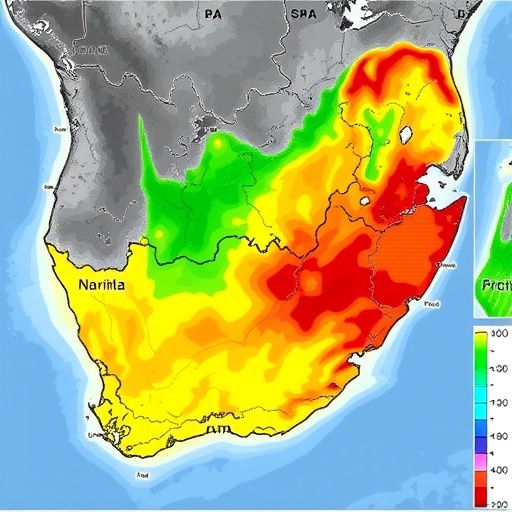
Durban, one of Africa’s fastest-growing coastal cities, now has the most detailed picture yet of where extreme rainfall will strike hardest. A team of researchers at the University of KwaZulu-Natal has produced a municipal-scale risk map of eThekwini Municipality that pinpoints, suburb by suburb, which communities face the greatest threat from the kind of torrential storms that killed more than 400 people in April 2022. The study, published in the journal Discover Cities, combines satellite rainfall records, terrain data, soil properties, and even the density of buildings across the city to reveal a stark east-west divide: the danger is concentrated along the densely built coastline, while the elevated western peripheries remain comparatively safe.
The research comes at a critical moment. Extreme rainfall disasters worldwide have increased by more than 50 percent over the past two decades, and South Africa’s southeastern coast is projected by the Intergovernmental Panel on Climate Change to experience more frequent, short-duration downpours as the climate warms. Durban’s April 2022 floods, among the deadliest in the country’s recorded history, exposed critical weaknesses in early warning systems and urban preparedness, particularly in informal settlements clinging to steep slopes and low-lying ground. Yet until now, municipal planners lacked a single spatial framework that integrated the atmospheric, environmental, and urban factors that together determine where extreme rainfall turns into disaster.
Led by Simangaliso Mnyandu, with colleagues Silas Njoya Ngetar and Ntombifuthi Nzimande, the study applied a GIS-based Multi-Criteria Analysis (MCA) weighted through the Analytical Hierarchy Process (AHP), a structured decision-making method that converts expert and literature-derived judgments into numerical weights. The team selected eight conditioning factors spanning three conceptual domains drawn from the Disaster Risk Framework: hazard variables, environmental risk indicators, and exposure measures. Rainfall intensity and wind speed represented the atmospheric hazard; slope, land use/land cover, soil drainage, soil bulk density, and elevation captured the environmental conditions that govern runoff and infiltration; and building footprint density served as a proxy for what is physically exposed on the ground.
The data pipeline was ambitious in its scope and international in its sources. Rainfall records came from the Climate Hazards Group InfraRed Precipitation with Station data (CHIRPS) dataset, accessed through Google Earth Engine, at a resolution of roughly 5 kilometres. The researchers focused on January through April, the months that historical flood chronologies identify as Durban’s most dangerous, and aggregated rainfall from 2019, 2022, and 2024, years corresponding to major documented flood events. Wind speed was extracted from the European Centre for Medium-Range Weather Forecasts ERA5-Land dataset, chosen for its improved representation of land-surface processes compared to the standard ERA5 product. Land cover came from the European Space Agency’s WorldCover product at a sharp 10-metre resolution, while slope was derived from a 5-metre Digital Elevation Model supplied by the municipality itself. Soil texture, drainage, and bulk density were drawn from the ISRIC Soil Data Hub, and building footprint polygons from the eThekwini Municipality Corporate GIS Unit.
Because these datasets arrived at wildly different scales, ranging from 5 metres to 9 kilometres per pixel, the team harmonised everything onto a common 50-metre analysis grid. Continuous variables such as rainfall, wind, and soil bulk density were resampled with bilinear interpolation to preserve smooth surface characteristics, while categorical layers like land cover and soil texture used nearest-neighbour interpolation to keep class boundaries intact. The building footprints were converted into a continuous density surface using kernel density analysis, effectively producing a map of how many structures crowd each square kilometre of the city.
The weighting process lay at the heart of the model. Using Saaty’s 1-to-9 pairwise comparison scale, the researchers judged rainfall intensity to be by far the dominant driver, earning a weight of 0.392, nearly 40 percent of the total. Slope followed at 0.176, reflecting how rapidly water accelerates across Durban’s escarpments and undulating terrain, and wind speed took 0.108 for its role in steering and intensifying coastal storm systems. Soil characteristics, land cover, and building density received smaller weights, because they modulate local risk rather than driving the storms themselves. Critically, the consistency of these judgments passed the standard statistical test: the Consistency Ratio of 0.0398 fell well below the 0.10 threshold, confirming that the weighting scheme was internally coherent rather than arbitrary.
When the weighted layers were overlaid in ArcGIS Pro, the resulting map told a vivid story. High-risk zones cluster along the eastern coastal belt and adjacent peri-urban corridors, sweeping through Durban Central, Umlazi, Isipingo, Chatsworth, and the densely populated townships of KwaMashu and Ntuzuma. These are places where extensive impervious surfaces choke infiltration, drainage systems run at capacity, low-lying topography invites water accumulation, and poorly drained, compacted soils repel rainfall rather than absorbing it. Moderate risk forms a transitional belt stretching inland through areas such as Pinetown, Clermont, and parts of Marianhill, while low and very low risk dominate the higher, greener western and northern margins around Hillcrest, Assagay, Kloof, and the rural upper catchments of Inanda and Umzinyathi.
Statistical rigor backed the visual pattern. A Getis-Ord Gi* hotspot analysis, which tests whether clusters of high values are statistically significant or mere chance, confirmed the geography with striking precision. Durban, Umlazi, Isipingo, Kwamakhutha, KwaMashu, Ntuzuma, and Avoca emerged as hotspots at the 99 percent confidence level, with additional significant clusters in Chatsworth, Lamontville, the Bluff, Amanzimtoti, and Phoenix. Cold spots mirrored them in the west, centred on Hammarsdale, Botha’s Hill, Hillcrest, and Shongweni. Suburb-level rankings added a third layer of corroboration: KwaMashu topped the table with 85 percent of its land classified as high risk, followed by Isipingo at 79.9 percent, Umbogintwini at 78 percent, and Kwamakhutha at 71.6 percent. The convergence of three independent analytical outputs on the same spatial signal, the authors note, gives strong confidence that the pattern is real rather than an artefact of the method.
Validation was quantitative as well as qualitative. The team tested the model against 400 validation points, half drawn from observed flood extent records and half randomly generated from non-occurrence locations. A Receiver Operating Characteristic analysis yielded an area under the curve of 0.8188, a value conventionally regarded as indicating good predictive performance for this class of model. A sensitivity analysis, in which the AHP-derived weights were perturbed by plus or minus 10 percent to simulate uncertainty in expert judgment, produced only minor shifts in the distribution of risk classes, confirming that the map is robust to small changes in its inputs.
The implications reach well beyond the map itself. The study aligns explicitly with Priority 1 of the Sendai Framework for Disaster Risk Reduction, which calls for understanding risk as the foundation of evidence-based planning, and with Sustainable Development Goals 11 and 13 on sustainable cities and climate action. In practice, the risk map offers municipal officials a decision-support tool for prioritising stormwater upgrades, early warning deployment, and risk-sensitive land-use decisions precisely where they will save the most lives and property. The authors argue that proactive investment in drainage maintenance, green infrastructure to restore infiltration, and planning controls that steer development away from the highest-risk zones could materially alter Durban’s future risk trajectory.
The researchers are candid about the model’s limits. The analysis relies on static, secondary datasets that cannot capture rapid land-use change or micro-scale variation, and resampling coarse climatic data to a 50-metre grid does not create genuine detail where none existed in the original observations. The map therefore represents relative risk at the municipal scale rather than parcel-level prediction. The absence of a high-resolution historical flood inventory also constrains validation, meaning the outputs describe susceptibility rather than absolute probability. And because direct socioeconomic vulnerability indicators were not included, the results capture physical exposure but not the full social dimension of disaster risk, a significant caveat in a municipality where marginalised communities often occupy the most dangerous terrain.
Even so, the findings echo a pattern documented in flood-prone coastal cities worldwide, from Toronto to Chongqing: dense urbanisation on low-lying ground with limited infiltration capacity consistently concentrates risk where people and pavement meet heavy rain. Durban’s version of that pattern carries a painful historical echo, with the highest-risk suburbs often being historically underserved communities, reinforcing arguments that climate hazards in South African cities reproduce broader patterns of injustice. The authors call for future work incorporating time-series rainfall data, climate change projections, locally calibrated hydrological models, and detailed flood inventories to sharpen the picture further. For now, the map provides eThekwini with something it has never had before: a rigorous, validated, and spatially explicit baseline showing exactly where the next extreme storm is most likely to hurt, and where adaptation efforts can begin.
Cite Scienmag News
Sloane Callahan. (September 5, 2026). GIS-based multi-criteria modelling maps extreme rainfall risk in South Africa. Scienmag. https://scienmag.com/gis-based-multi-criteria-modelling-maps-extreme-rainfall-risk-in-south-africa/
Sloane Callahan. "GIS-based multi-criteria modelling maps extreme rainfall risk in South Africa." Scienmag, 5 September 2026, https://scienmag.com/gis-based-multi-criteria-modelling-maps-extreme-rainfall-risk-in-south-africa/. Accessed 5 September 2026.
Sloane Callahan. "GIS-based multi-criteria modelling maps extreme rainfall risk in South Africa." Scienmag. September 5, 2026. https://scienmag.com/gis-based-multi-criteria-modelling-maps-extreme-rainfall-risk-in-south-africa/


