


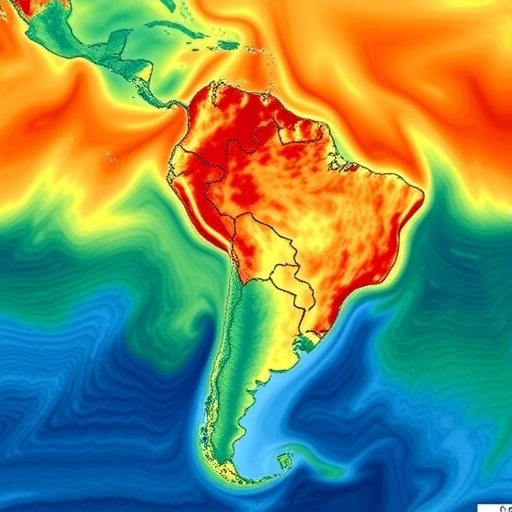
South America’s climate extremes are being shaped by a powerful atmospheric tug-of-war between the Pacific and Atlantic oceans, according to a continent-wide analysis of 25 years of high-resolution observations. The study finds that El Niño–Southern Oscillation (ENSO) is the dominant statistical influence on rainfall and temperature extremes, producing a striking north–south contrast: drought and weakened rainfall across much of the Amazon and northeastern Brazil, but wetter and more intense precipitation across southern Brazil, Uruguay, Paraguay and northeastern Argentina. La Niña generally reverses this pattern, although its drying influence over southeastern South America is substantially stronger than El Niño’s wetting effect. The results offer a detailed map of where climate hazards are most likely to intensify—and how much warning ocean conditions may provide.
Researchers analyzed daily precipitation and temperature data from 2000 through 2024, calculating eight standardized indices developed by the Expert Team on Climate Change Detection and Indices, or ETCCDI. These measures capture both the intensity and persistence of extremes, including total precipitation, the longest wet and dry spells, the maximum rainfall accumulated over five days, the coldest nighttime temperature, frost frequency, the hottest daytime temperature and the number of tropical nights. The precipitation analysis used MERGE, a dataset combining satellite estimates with rain-gauge observations at roughly 10-kilometer resolution. Temperature data came from SAMeT, which merges weather-station records with ERA5 reanalysis and corrects for elevation effects at a resolution of about five kilometers.
That fine spatial detail revealed a continent of sharply contrasting climate regimes. The Amazon Basin and northern South America showed the highest total rainfall and longest wet spells, reflecting deep tropical convection and the seasonal migration of the Intertropical Convergence Zone, a broad belt of rising, moisture-laden air near the equator. Central-eastern Brazil, by contrast, emerged as a hotspot for prolonged dry spells. There, the sinking air associated with the South Atlantic Subtropical High suppresses cloud formation, while the South American monsoon creates a pronounced dry season from roughly April to September. Northeastern Brazil is also affected by subsidence linked to the Walker circulation, the east–west overturning circulation that connects tropical Pacific ocean temperatures with atmospheric rainfall.
Rainfall intensity did not always follow the same geography as rainfall totals. The largest five-day precipitation extremes occurred not only in the Amazon but also across western southern Brazil, northeastern Argentina and the La Plata Basin. These areas are influenced by the South American Low-Level Jet, a fast-moving corridor of warm, humid air that transports moisture southward from the Amazon along the eastern side of the Andes. When this moisture encounters frontal systems and upper-level winds, it can fuel organized mesoscale convective systems—large clusters of thunderstorms capable of producing extraordinary rainfall over several days. Southern Chile formed another distinct exception: frequent mid-latitude storms collide with the Andes, forcing moist air upward and generating heavy orographic precipitation while keeping dry spells relatively short.
The temperature patterns were even more geographically coherent. Cold-night temperatures increased toward the tropics, while frost days rose sharply with latitude and elevation, reaching their highest frequencies across southern Argentina, Patagonia and the high Andes. Tropical nights—nights when minimum temperatures remain unusually warm—were most common across northern and central South America. During the observation period, maximum daytime temperatures typically fell within a relatively narrow 30–35 °C range across the major river basins, while extreme minimum temperatures varied more strongly with latitude, terrain and the arrival of polar air masses. This contrast matters because persistent nighttime warmth can prevent people, ecosystems and crops from recovering from daytime heat, increasing heat stress even when daytime temperature records do not rise dramatically.
The researchers also detected regional changes between 2000 and 2024. Central-eastern and southern South America showed declining total precipitation, shorter wet spells, weaker five-day rainfall extremes and longer dry spells. Northwestern regions displayed the opposite tendency, with more precipitation, longer wet periods, stronger multi-day rainfall and fewer consecutive dry days. Maximum temperatures warmed across nearly the entire continent, while minimum temperatures also rose across most regions. Frost frequency generally declined in southern South America, and tropical nights increased across much of the continent. But the authors caution that these are observed changes over only 25 years, not definitive measurements of long-term human-caused climate change. Natural fluctuations operating over 20- to 70-year timescales, including the Pacific Decadal Oscillation and Atlantic Multidecadal Oscillation, may have contributed substantially to the pattern.
ENSO produced the clearest and most statistically coherent climate signal. During El Niño, unusually warm sea-surface temperatures in the eastern equatorial Pacific alter the Walker circulation and launch planetary-scale Rossby waves—meandering disturbances in the upper atmosphere that can travel thousands of kilometers. Across eastern Amazonia and northeastern Brazil, the resulting atmospheric subsidence and northward displacement of the Intertropical Convergence Zone were associated with reduced rainfall, shorter wet spells and weaker five-day precipitation events. Southern Brazil, Uruguay, Paraguay, northeastern Argentina and parts of central Chile experienced the opposite combination: more rain, longer wet spells, stronger multi-day events and fewer consecutive dry days. La Niña reversed the broad arrangement, but the study found that its drying signal over southeastern South America was stronger and more spatially organized than El Niño’s wetting signal.
The response was not instantaneous or uniform. Rainfall anomalies in southeastern South America often appeared within zero to two months of ENSO conditions, consistent with rapid atmospheric teleconnections and quick changes in the Low-Level Jet and frontal activity. Amazonian responses typically emerged over one to three months as the Walker circulation adjusted tropical convection. Northeastern Brazil showed longer delays of three to six months, a timing that may reflect the role of tropical Atlantic sea-surface temperatures as an intermediary between Pacific forcing and regional rainfall. Temperature extremes generally responded more slowly than precipitation, with ENSO-related signals commonly peaking after two to six months as ocean-driven circulation changes altered cloud cover, moisture and the continental energy balance.
Tropical Atlantic Variability, measured through the contrast between sea-surface temperatures in the northern and southern tropical Atlantic, had a more localized influence. Its most robust continental signal appeared over eastern Amazonia south of the equator, where the Atlantic temperature gradient can shift the Intertropical Convergence Zone and reorganize convection. The negative phase was associated with enhanced rainfall and stronger five-day precipitation events in that region, while the positive phase generally produced weaker or mixed continental signals. Over southeastern South America, Tropical Atlantic effects were noisy and mostly statistically insignificant. The South Atlantic Ocean Dipole also contributed to variability through changes in the South Atlantic Subtropical High and moisture transport, but its influence was weaker than ENSO’s in the analyzed data.
A combined index designed to capture simultaneous forcing from ENSO, Tropical Atlantic Variability and the South Atlantic Ocean Dipole produced a surprising result: it was generally weaker and less coherent than ENSO alone. The index was formed by statistically removing overlap among the oceanic modes, standardizing them and adding them together. Although it identified periods when modes acted in the same direction, it missed potentially important combinations in which opposite phases produced reinforcing regional effects. For example, El Niño can suppress rainfall over northern South America while a negative Atlantic phase simultaneously enhances convection in parts of the same broad region; a simple sum may treat those opposing signs as cancellation even when their spatial impacts compound. The finding does not mean ocean modes never amplify one another, but it shows that a single linear index may be a poor tool for capturing geographically complex interactions.
The basin-scale results sharpen the practical implications. Across all nine major South American river basins examined, dry spells were typically much longer than wet spells: consecutive dry days commonly lasted 10–15 days, whereas wet spells usually persisted for only three to five days. The contrast was especially pronounced in the Pampas and Pacific coastal basins. Weibull probability distributions, which are well suited to asymmetric duration data with long tails, provided the best fit for the distributions of both dry and wet spells. Such information can help water managers distinguish basins vulnerable to drought persistence from those exposed to short, intense rainfall. The authors emphasize, however, that these distributions describe the period as a whole and do not by themselves reveal whether conditions changed over time.
The study arrives amid vivid reminders of South America’s vulnerability to compound extremes. Floods and landslides in Rio Grande do Sul between April and May 2024 affected 478 of the state’s 497 municipalities and approximately 2.4 million people, while the Amazon experienced an exceptional drought in 2023–24 that disrupted river transport, ecosystems and livelihoods. The new analysis links such risks to a hierarchy of climate drivers: ENSO supplies the strongest continent-wide signal, while Atlantic variability adds regionally specific adjustments that may be crucial for forecasting in eastern Amazonia and northeastern Brazil. Because the statistical methods identify associations rather than prove physical causation, the researchers say future work should combine longer records with direct analyses of winds, moisture fluxes and upper-atmospheric circulation. Seasonal composites and nonlinear classifications of mixed oceanic phases could ultimately turn the patterns into more reliable, region-specific climate services for agriculture, hydropower, wildfire prevention, public health and disaster planning.
Cite Scienmag News
Eleanor C. (August 28, 2026). New study reveals how oceanic teleconnections shape South America’s climate extremes. Scienmag. https://scienmag.com/new-study-reveals-how-oceanic-teleconnections-shape-south-americas-climate-extremes/
Eleanor C. "New study reveals how oceanic teleconnections shape South America’s climate extremes." Scienmag, 28 August 2026, https://scienmag.com/new-study-reveals-how-oceanic-teleconnections-shape-south-americas-climate-extremes/. Accessed 28 August 2026.
Eleanor C. "New study reveals how oceanic teleconnections shape South America’s climate extremes." Scienmag. August 28, 2026. https://scienmag.com/new-study-reveals-how-oceanic-teleconnections-shape-south-americas-climate-extremes/


