


A Hidden Drought Signal Is Emerging Beneath the Brahmaputra Valley
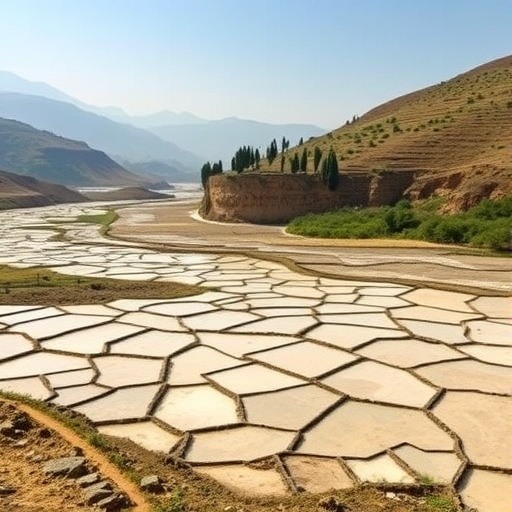
The Brahmaputra Valley is famous for monsoon rains, sweeping floods and one of the world’s great river systems. Yet beneath that apparently water-rich landscape, drought is becoming a recurring threat. A new analysis of conditions across North-East India suggests that the key to understanding this paradox may lie not only in rainfall, but in the water stored in the soil. By combining atmospheric measurements, land-surface observations and long-term reanalysis data, researchers have identified a tightening relationship between declining soil moisture and drought across the valley—along with evidence that the region’s hydroclimate may have shifted into a new regime during the early 2000s and 2010s.
The study, published in Theoretical and Applied Climatology, examined the Brahmaputra Valley using data from 1980 to 2022. The researchers focused on root-zone soil moisture, the water held in the layer of soil accessible to plant roots, rather than relying exclusively on rainfall totals. This distinction is crucial. Rain can be abundant over a season while plants still experience water stress if precipitation arrives in short, intense bursts, runs off quickly or is followed by prolonged heat. Soil moisture integrates these competing influences, acting as a kind of memory of recent weather. It reflects rainfall, evaporation, plant water use, drainage and the ability of soil to retain water—making it a powerful indicator of whether an ecosystem is truly recovering from, or sliding into, drought.
To track that hidden water supply, the team used root-zone soil moisture at a depth represented as SM100, derived from the ERA5-Land reanalysis. Reanalysis systems combine observations with numerical weather and land-surface models to reconstruct environmental conditions consistently across large regions and long periods. The researchers then compared soil moisture with several independent drought measures. These included the Standardised Precipitation Index, or SPI, which identifies unusually wet or dry precipitation totals; the Standardised Precipitation Evapotranspiration Index, or SPEI, which also accounts for atmospheric water demand; and the Palmer Drought Severity Index, or PDSI, a water-balance measure that estimates the cumulative effects of moisture deficits. Satellite-derived indicators added another perspective by revealing how vegetation and land-surface temperature responded to changing water availability.
Those remote-sensing measures capture different stages of drought stress. The Temperature Condition Index, or TCI, uses land-surface temperature to identify unusually hot conditions, which often develop when soils lack enough water for evaporative cooling. The Vegetation Condition Index, or VCI, assesses the health of plant cover relative to its historical range, while the Vegetation Health Index, or VHI, combines temperature and vegetation information. In a healthy, well-watered landscape, available energy is partitioned between heating the land and evaporating water. As the soil dries, less energy can be spent on evaporation and more remains as sensible heat, raising surface temperatures. Plants may then close their stomata—tiny pores that regulate gas exchange—to limit water loss, but this also restricts carbon dioxide uptake and photosynthesis. The resulting feedback can intensify both ecological stress and local heat.
Across the valley, the researchers found strong connections between root-zone soil moisture and the satellite-based drought indices, although the strength and geographic pattern of those relationships varied by season. That seasonal variation is expected in a region governed by the Indian summer monsoon. During the wet season, rainfall can rapidly replenish surface layers, while deeper soil may respond more slowly depending on soil texture, drainage and vegetation. During the drier months, root-zone storage becomes more important because plants draw on water accumulated earlier in the year. The findings suggest that a rainfall-only drought monitor could miss important changes in the land’s capacity to sustain vegetation between rain events. A location may appear safe when judged by precipitation, even as the moisture reservoir beneath the surface is steadily shrinking.
The long-term trends were especially concerning. Both PDSI and root-zone soil moisture showed declining tendencies over the study period. PDSI incorporates precipitation, temperature and estimated losses of water from the land, so its downward trend indicates worsening overall moisture conditions rather than simply fewer rainy days. Soil moisture, meanwhile, can decline when rising evaporative demand pulls water from the ground faster than rainfall can replace it. Warmer air increases the atmosphere’s capacity to hold water vapour, potentially accelerating evaporation and plant transpiration even where precipitation totals do not collapse. This mechanism helps explain why drought can intensify in a region that continues to receive substantial monsoonal rainfall.
The analysis also detected abrupt changes rather than a smooth, uniform decline. Using cumulative sum, or CUSUM, methods, the researchers searched for points at which the statistical behaviour of a time series shifted. Standard CUSUM analysis identified 2011 as a breakpoint in PDSI and 2005 as a breakpoint in the anomaly of the fraction of available water, abbreviated Faw. A recursive version of the method identified 2011 as a shared change point in both records. In practical terms, these results suggest that the relationship between atmospheric supply and land-surface water may have changed during the first decades of the twenty-first century. A change point does not by itself establish a single cause, but it can flag a transition that deserves closer investigation, including the possible roles of warming, monsoon variability, land-use change and large-scale climate drivers.
To explore how drought signals operate over different timescales, the researchers applied Multi-Channel Singular Spectrum Analysis, or MSSA. The technique decomposes several linked time series into oscillations, trends and residual variations, allowing scientists to identify patterns that may be obscured in raw data. The analysis showed that PDSI and the Faw anomaly shared their strongest coherent variability at an interannual timescale of roughly three years. That periodicity does not mean drought arrives like clockwork every three years. Instead, it indicates that fluctuations operating over several years can influence both the broader water-balance index and the fraction of available water in the soil. The Faw record also contained additional low-frequency persistence, consistent with subsurface moisture memory: water stored deeper in the soil can continue shaping drought conditions long after the rainfall event that supplied it has passed.
That memory could become a critical factor for agriculture, ecosystems and water planning in the valley. Soil moisture affects seed germination, crop growth, irrigation demand and the ability of vegetation to withstand heat. It also influences the exchange of water and energy between the land and atmosphere, potentially affecting boundary-layer development and local temperature extremes. When dry soils persist, a region can move from an initial rainfall deficit to a compound hot-and-dry episode in which heat further accelerates moisture loss. Conversely, when soil reservoirs remain healthy, vegetation can continue transpiring and moderating surface temperatures even during short rainless spells. Monitoring the root zone therefore offers an opportunity to detect stress before visible vegetation damage becomes widespread.
The researchers argue that drought surveillance in the Brahmaputra Valley should integrate soil moisture with meteorological and satellite indicators rather than treating any single index as definitive. Rainfall-based measures are valuable for detecting an immediate precipitation shortfall, while SPEI can reveal the influence of temperature-driven atmospheric demand. PDSI provides a longer water-balance perspective, and satellite indices can show how plants and land surfaces are responding in near-real time. Soil moisture links these perspectives by representing the water actually available to roots. Together, the indicators could support earlier warnings, more targeted irrigation decisions and climate-resilience planning tailored to different seasons and landscapes.
The study does not claim that every dry period in the valley has the same origin, nor that soil moisture alone can predict future drought. Reanalysis products and remote-sensing indices carry uncertainties, particularly in a region with complex terrain, intense monsoon rainfall and diverse land cover. Still, the agreement among independent measures strengthens the central message: drought is not simply the absence of rain. It is a developing land-surface process, shaped by how much water enters the soil, how quickly heat and vegetation remove it, and how long deeper layers retain what remains. In a region better known for floods than water scarcity, that hidden shift beneath the surface could become one of the most consequential climate signals of all.
Cite Scienmag News
Eleanor Cresswell. (August 28, 2026). New study reveals how soil moisture drives worsening droughts in Brahmaputra Valley. Scienmag. https://scienmag.com/new-study-reveals-how-soil-moisture-drives-worsening-droughts-in-brahmaputra-valley/
Eleanor Cresswell. "New study reveals how soil moisture drives worsening droughts in Brahmaputra Valley." Scienmag, 28 August 2026, https://scienmag.com/new-study-reveals-how-soil-moisture-drives-worsening-droughts-in-brahmaputra-valley/. Accessed 28 August 2026.
Eleanor Cresswell. "New study reveals how soil moisture drives worsening droughts in Brahmaputra Valley." Scienmag. August 28, 2026. https://scienmag.com/new-study-reveals-how-soil-moisture-drives-worsening-droughts-in-brahmaputra-valley/


