
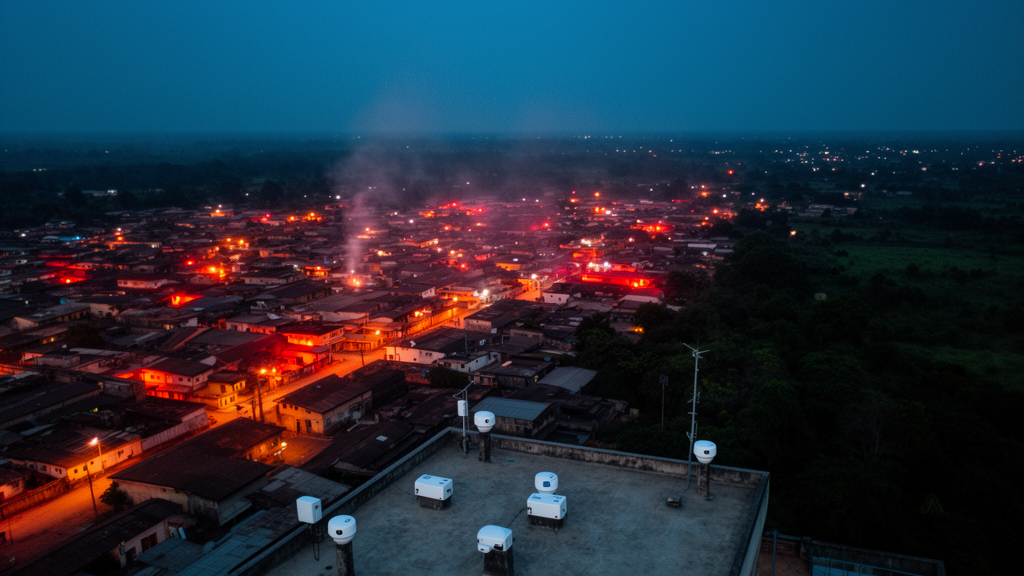
A year of continuous temperature and humidity measurements across two fast-growing cities in southwestern Nigeria has revealed a clear urban heat signature that behaves very differently by day and by night. Sensors installed at sixteen sites in Abeokuta and Shagamu, in Ogun State, recorded heat index values every ten minutes from February 2020 to March 2021, giving researchers the first continuous, in-situ, year-long heat stress dataset for these cities. The results, published in Discover Atmosphere, show that urban sites consistently ran hotter than rural ones, that Shagamu outpaced Abeokuta throughout the year, and that the single most extreme reading of the entire campaign, a heat index of 45.0 degrees Celsius in the danger category, occurred at the one site whose surrounding landscape was completely built up.
Twelve sites covered four local government areas of Abeokuta, the Ogun State capital, while four sites spanned Shagamu, the state’s industrial corridor and home to one of Nigeria’s largest cement plants. Before deployment, every logger was calibrated against a certified mercury thermometer accurate to 0.2 degrees Celsius and a calibrated psychrometer, and the instruments were shaded and ventilated according to World Meteorological Organization guidelines to keep direct solar heating from biasing the readings.
Classifying each site as urban or rural was not left to impression alone. Field observations provided the primary grouping, but the researchers then drew land cover data from a remote sensing repository and, using a geographic information system, calculated the composition of a circular 1-kilometre buffer around every logger. The two approaches agreed closely. Urban sites such as Isale-Igbeyin, Yidi, Adigbe, Iwara and Kuto had built-up cover exceeding 92 percent of their buffers, with Isale-Igbeyin at a full 100 percent. Rural sites such as Ajebo, Obafe and Obada-Oko were dominated by vegetation, cropland or rangeland. Two transitional sites, Kinleyin and Sotubo, with roughly half their buffers built up, were kept in their original rural category because the field classification also weighed vegetation, population density and landscape morphology.
From the paired temperature and humidity records the team computed the heat index using the National Weather Service model, a widely validated regression that expresses perceived temperature as a function of both variables. The index matters because combinations of heat and humidity can push perceived conditions beyond human physiological tolerance, typically around 35 to 37 degrees Celsius, raising the risk of heat-related illness. Across the network, caution-range values appeared at every site at some point during the year, and extreme caution conditions, signalling possible sunstroke, heat cramps and heat exhaustion, were recorded at several locations in both cities. The study also confirmed a deceptively simple point with practical consequences: nearly identical heat index values can arise from quite different temperature-humidity combinations, so assessing the two variables together is essential in humid tropical settings.
The spatial contrasts were consistent and statistically robust. Rural Shagamu averaged a heat index of 31.64 degrees Celsius against 30.29 in rural Abeokuta, a difference of 1.35 degrees that was highly significant. Urban Shagamu averaged 32.06 against 30.49 in urban Abeokuta, a gap of 1.56 degrees. Within each city, urban sites edged out rural ones by 0.20 degrees in Abeokuta and 0.41 degrees in Shagamu, both statistically significant. The authors attribute Shagamu’s higher readings to its industrial profile, including cement manufacturing and mining, alongside lower vegetation cover at its rural sites, while Abeokuta’s heat reflects urbanization and vehicular and domestic activity across its rocky, increasingly impervious terrain.
The most striking finding emerged only when the ten-minute raw data were aggregated into mean hourly profiles. Averaged over the full 24-hour cycle, urban sites were significantly hotter than rural ones, but that average conceals two opposing patterns. From roughly 18:00 through 08:00, urban sites ran warmer than rural sites by up to 1.6 degrees Celsius in heat index, the classic nocturnal urban heat island signature in which built surfaces store daytime heat and release it slowly overnight while restricted sky views limit radiative cooling. From roughly 09:00 to 17:00 the pattern reversed, with rural heat index exceeding urban values by up to 1.1 degrees, peaking near 14:00. Because the daytime air temperature difference was negligible, the reversal is most plausibly driven by higher daytime humidity at vegetated rural sites, consistent with evapotranspiration from plants. Peak heat index also arrived one hour earlier at urban sites, at 13:00, than at rural sites, at 14:00, a detail with direct relevance for scheduling outdoor work.
Seasonally, the heat index followed the bimodal rhythm of southwestern Nigeria’s two-season climate, peaking during the dry season from November to March and dipping during the core of the wet season from July to September. Sixth-order polynomial fits captured more than 60 percent of the seasonal variability at every site group, and monthly box plots confirmed the pattern, with median heat index exceeding the 32-degree reference threshold in most dry-season months. The authors link the seasonal swing to reduced precipitation and enhanced solar radiation in the dry months, when the Harmattan brings dry continental air and clearer skies, and to increased cloud cover and convective rainfall during the wet season when the rain belt migrates northward.
To move beyond description, the researchers related the observed heat index to five meteorological variables from the ERA5-Land reanalysis dataset, extracted for each of the sixteen locations: surface net and downward solar radiation, surface net and downward thermal radiation, and total cloud cover. Pearson correlations showed the heat index rising strongly with net solar radiation and downward solar radiation, and falling with total cloud cover and net thermal radiation, while downward thermal radiation showed only a weak, statistically insignificant association. Principal component analysis reduced the five predictors to two independent dimensions that together accounted for 95.81 percent of their shared variance, the first and dominant one a solar radiation-cloud cover axis explaining 74.91 percent. In short, sunshine and cloudiness, not incoming longwave radiation, were the principal meteorological correlates of heat stress across the network.
One much-discussed phenomenon failed to materialize. Using an exploratory definition of a heat wave as three or more consecutive days with a daily mean heat index of at least 32 degrees Celsius, the team found no qualifying events during the entire monitoring period. They are careful, however, to present this as a secondary observation rather than a headline result. Fixed absolute thresholds are poorly suited to tropical climates, where a heat index of 32 degrees can be an unremarkable baseline rather than an anomaly, and such thresholds ignore the acclimatization of local populations. A percentile-based definition that references each station’s own climatology would require a multi-year baseline record that a single year of monitoring cannot provide, so a robust heat wave characterization for the region remains future work.
The authors also flag honest limitations. The study period coincided with the early phase of the COVID-19 pandemic, which may have temporarily altered traffic and industrial activity in ways that could not be quantified. Two urban Abeokuta sites showed short runs of suspected logger-fault values in April and May 2020, retained in the plots but flagged for verification. The full multiple regression of heat index on the ERA5-Land variables was still being finalized at the time of writing, with the correlation and component analyses standing as the quantitative evidence for now. Even so, the combination of continuous in-situ monitoring, objective satellite-based land cover characterization and multivariate meteorological analysis offers a template the authors hope will spread across a region where sustained observational data remain scarce, and the underlying dataset has been released openly through Zenodo for other researchers to build on.
Subject of Research: Heat index variability and urban heat island dynamics in Abeokuta and Shagamu, southwestern Nigeria
Article Title: Assessment of heat index variability and urban heat island dynamics across Abeokuta and Shagamu, Southwestern Nigeria
Article References: Ogundeji, S. T., Akinyemi, O. D., Bada, B. S., & Oyedepo, J. A. (2026). Assessment of heat index variability and urban heat island dynamics across Abeokuta and Shagamu, Southwestern Nigeria. Discover Atmosphere, 4(1), Article 29. https://doi.org/10.1007/s44292-026-00096-4
Image Credits: AI Generated
DOI: 10.1007/s44292-026-00096-4
Keywords: urban heat island, heat index, Nigeria, Abeokuta, Shagamu, heat stress, ERA5-Land, principal component analysis, land cover, humidity, dry season, thermal comfort
Cite Scienmag News
Russell Cooper. (October 27, 2026). Year-Long Sensor Network Reveals Night-Time Urban Heat Island in Two Nigerian Cities. Scienmag. https://scienmag.com/year-long-sensor-network-reveals-night-time-urban-heat-island-in-two-nigerian-cities/
Russell Cooper. "Year-Long Sensor Network Reveals Night-Time Urban Heat Island in Two Nigerian Cities." Scienmag, 27 October 2026, https://scienmag.com/year-long-sensor-network-reveals-night-time-urban-heat-island-in-two-nigerian-cities/. Accessed 29 October 2026.
Russell Cooper. "Year-Long Sensor Network Reveals Night-Time Urban Heat Island in Two Nigerian Cities." Scienmag. October 27, 2026. https://scienmag.com/year-long-sensor-network-reveals-night-time-urban-heat-island-in-two-nigerian-cities/