


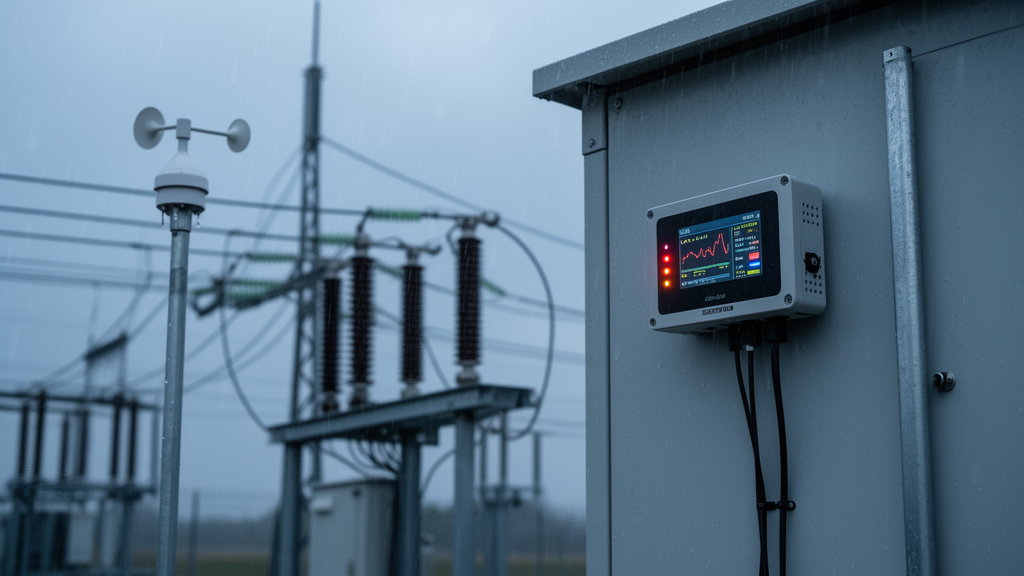
A lightweight, weather-aware forecasting system cut electricity-demand prediction errors during extreme conditions while running in less than 10 milliseconds on an edge computer, according to a study of grid data from California and New England. The ClimateEdge framework combined weather features, a specialized recurrent neural network, 8-bit quantization and a rule-based demand-response alert system. On 389 hourly California records from the extreme-weather portion of a chronological test set, its Climate-Enhanced Long Short-Term Memory, or CE-LSTM, achieved a mean absolute error of 471.8 megawatts and a mean absolute percentage error of 1.55%. On 58 extreme-weather records from ISO New England, the corresponding results were 329.6 MW and 2.31%. These were retrospective forecasting evaluations, not trials of grid operators using the system in live demand-response programs.
The research tested whether a compact model could improve short-term load forecasts specifically during heat waves and cold snaps, rather than allowing exceptional events to be diluted within annual averages. The California dataset contained 20,422 hourly records from June 2020 through September 2022, including 1,228 records flagged as extreme by a rule combining Sacramento temperature above 35 degrees Celsius or 10-meter wind speed above 20 meters per second. The New England dataset comprised 5,813 hourly records from July 2023 through February 2024, with 210 extreme records identified by a Boston temperature below minus 5 degrees Celsius or wind speed above 15 meters per second. In California, median load during flagged periods was 37,149 MW, compared with 24,007 MW otherwise. The corresponding New England medians were 14,101 MW and 12,963 MW.
Each forecast used 24 hours of history to predict the following six hours. The input combined grid load with air temperature, relative humidity, precipitation, wind speed, a derived Weather Severity Index and a binary extreme-weather flag. The severity index condensed the meteorological variables into a value from zero to one, with temperature entering in the opposite direction for the heat-sensitive California case and the cold-sensitive New England case. This index served a dual purpose: it provided the network with an explicit measure of climatic stress and increased the penalty applied to errors during severe windows. The model was trained separately for the two operators but without dataset-specific changes to the network architecture or shared hyperparameters.
The CE-LSTM itself contained 2,107,718 trainable parameters across three stacked recurrent layers with 512, 256 and 128 hidden units. An additive temporal-attention layer assigned different relevance to the 24 input hours, allowing the decoder to emphasize periods associated with unusually high or low temperature. The weather-weighted loss used a penalty coefficient of 0.35, selected by validation-set grid search. This design targeted the study’s central concern: an ordinary mean-squared-error objective can allow abundant routine observations to dominate training even when forecasts during the most consequential events remain imperfect.
Across both extreme-weather test partitions, the CE-LSTM produced the lowest errors among six evaluated models. On California, its MAE of 471.8 ± 19.3 MW was 21.1% below the next-best model, an iTransformer with an MAE of 598.3 ± 29.4 MW. Its RMSE was 693.2 ± 24.7 MW and its MAPE was 1.55 ± 0.07%. A two-sample t-test comparing the five runs of the CE-LSTM and iTransformer gave t(8) = 6.53, p = 0.0002 and Cohen’s d = 5.09. On New England, the CE-LSTM’s 329.6 ± 17.9 MW MAE was 19.4% below the iTransformer’s 408.9 ± 27.1 MW; the statistical comparison gave t(8) = 12.46, p < 0.0001 and d = 3.45. The paper reported significance tests only against the iTransformer, not the other four baselines.
Deployment measurements showed the benefit of converting the trained FP32 model to static INT8 precision with TensorFlow Lite. On an NVIDIA Jetson Nano, the quantized CE-LSTM used 8.1 ± 0.2 MB of runtime memory, completed an inference step in 9.2 ± 0.5 milliseconds, drew 3.4 ± 0.2 watts and occupied 23 ± 2% of the CPU during sustained testing. By comparison, the FP32 version used 29.8 MB, required 33.6 milliseconds and consumed 5.7 watts. Quantization therefore produced a 3.65-fold latency speedup and 3.68-fold memory reduction for a 0.98% relative increase in MAE, from 467.2 to 471.8 MW in the reported accuracy-latency comparison. Four-bit quantization was faster still, at 5.6 milliseconds, but increased MAE by 26.2%, a trade-off the authors considered unsuitable for the proposed safety-critical use.
Ablation experiments indicated that explicit weather information supplied most of the accuracy gain. On the California extreme partition, removing all weather features increased MAE by 48.0%, from 471.8 to 698.2 MW. The binary extreme-weather flag had the largest individual effect: removing it raised MAE by 31.7%. Removing temperature increased error by 21.6%, while removing humidity, precipitation or wind speed raised it by 10.2%, 9.3% and 8.6%, respectively. Removing temporal attention increased MAE by 15.2% to 543.6 MW, while replacing the weather-weighted loss with ordinary mean squared error increased it by 6.4% to 501.9 MW. Perturbing any one Weather Severity Index coefficient by 20% changed MAE by at most 1.5%, suggesting the reported performance was not highly sensitive to the selected coefficient values.
The forecast was connected to a four-stage demand-response decision engine rather than used only as a prediction display. The system compared the six-step forecast with an operator-configured capacity threshold and assigned Normal, Advisory, Warning or Critical status. In three illustrative California cases, a forecast peaking at 50,100 MW against a 48,000 MW threshold produced a warning to activate demand curtailment; a 48,500 MW peak produced a conservation advisory; and a forecast declining to 38,200 MW generated a recommendation to restore deferred load. These examples show the engine’s logic, but they are not evidence that the alerts were dispatched or that demand-response programs achieved savings. The engine remained rule-based, and its threshold was fixed rather than supplied dynamically by a grid state estimator.
Several limitations constrain how broadly the results can be interpreted. The California study period covered 28 months, while the New England period covered eight months; the extreme-weather test partitions contained 389 and 58 records, respectively. Only 18 extreme California records appeared in validation, and the New England training split contained just eight flagged records out of 4,069, leaving the model with limited direct exposure to the cold-snap conditions it later predicted. The weather data for each grid came from one reference location—Sacramento for California and Boston for New England—rather than spatially resolved observations. Hyperparameters were also tuned once and shared among the deep-learning baselines, potentially disadvantaging architectures such as the iTransformer. The two US grids demonstrate performance in a summer-heat and winter-cold setting, but they do not establish generalization to other operators, renewable-heavy systems, monsoon-driven demand or live grid operations. The study nevertheless shows that carefully encoded weather stress, recurrent sequence modeling and aggressive but measured quantization can coexist in an edge forecasting system designed to remain responsive when grid demand changes abruptly.
Subject of Research: Weather-augmented edge AI for extreme-weather electricity-load forecasting and demand-response alerts
Article Title: ClimateEdge: a lightweight weather-augmented LSTM framework for real-time demand response in climate-stressed smart grids
Article References: A, H. K., Murugan, V., R, D., Prathiba, S. B., & Asai, S. R. (2026). ClimateEdge: a lightweight weather-augmented LSTM framework for real-time demand response in climate-stressed smart grids. Frontiers in Artificial Intelligence, 9, Article 1918025. https://doi.org/10.3389/frai.2026.1918025
Image Credits: AI Generated
DOI: 10.3389/frai.2026.1918025
Keywords: climate resilience, smart grids, load forecasting, extreme weather, edge AI, long short-term memory, temporal attention, model quantization, demand response, Jetson Nano, ClimateEdge, lightweight
Cite Scienmag News
Denise Maddox. (October 21, 2026). Weather-aware edge AI improves extreme-grid load forecasting. Scienmag. https://scienmag.com/weather-aware-edge-ai-improves-extreme-grid-load-forecasting/
Denise Maddox. "Weather-aware edge AI improves extreme-grid load forecasting." Scienmag, 21 October 2026, https://scienmag.com/weather-aware-edge-ai-improves-extreme-grid-load-forecasting/. Accessed 21 October 2026.
Denise Maddox. "Weather-aware edge AI improves extreme-grid load forecasting." Scienmag. October 21, 2026. https://scienmag.com/weather-aware-edge-ai-improves-extreme-grid-load-forecasting/


