


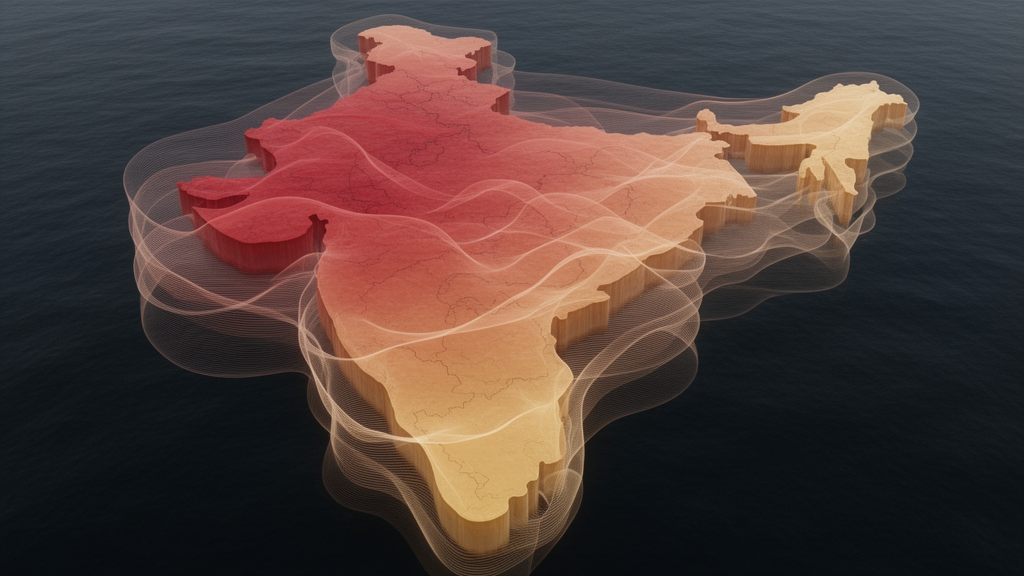
Fine particulate pollution rarely respects city boundaries. A study published in Environmental Monitoring and Assessment on 26 October 2026 introduces a signal-processing framework that estimates regional background PM2.5 concentrations across India, separating the pollution that arrives through long-range transport and diffuse regional emissions from the pollution generated by local sources. The work, led by Vikas and colleagues, uses the MERRA2 reanalysis dataset and wavelet transforms to build a spatiotemporal map of background concentrations at a spatial resolution that earlier statistical approaches lacked.
The core idea is that background pollution behaves like a low-frequency signal shared across neighboring regions. When a wavelet transform is applied to PM2.5 time series from adjacent grid cells, the low-frequency components that remain coherent across those cells reflect pollution arriving from far away or dispersed broadly across the landscape, rather than sharp, localized emissions. By isolating this coherent component, the method produces a background estimate that varies in both space and time, capturing how regional pollution regimes shift with seasons and meteorology.
The resulting background map reproduces the major pollution patterns expected across India. It captures the winter buildup of particulate pollution over the Indo-Gangetic Plain, where stagnant conditions and regional transport combine to elevate concentrations across a vast area. It also records the pre-monsoon dust-driven enhancements in the country’s northwest. According to the authors, the method correctly reproduces the transitions between polluted and clean periods, yielding a background pattern consistent with known seasonal and regional regimes.
To test the approach, the team compared their wavelet-derived background estimates with those from an established alternative: a Gaussian Mixture Model combined with a Hidden Markov Model, or GMM-HMM, applied at four major Indian cities. The agreement was quantified using the mean absolute deviation, which ranged from 2.2 micrograms per cubic meter in Kolkata to 10.8 micrograms per cubic meter in Delhi. This spread suggests the two methods converge most closely in cities where regional transport dominates, while diverging more where intense local emissions complicate the separation of background from local contributions.
A second diagnostic examined how the method behaves over grids classified as high-emission or low-emission. In low-emission grids, the derived background accounted for a larger share of total PM2.5, which is what one would expect where regional transport, rather than local sources, dominates the pollution load. In high-emission grids, the method yielded higher increments above the background, consistent with strong local contributions. The authors report that this contrast supports the framework’s ability to distinguish regional from local pollution signals.
The final evaluation compared the wavelet-based background against a benchmark constructed from the 5th percentile of observations, smoothed with piecewise cubic Hermite interpolation, known as PCHIP. Across the Delhi monitoring network, the method showed moderate agreement, with a mean absolute error of 21.95 micrograms per cubic meter and a root mean square error of 29.45 micrograms per cubic meter. At a dedicated background site in Delhi, however, performance improved substantially, with the mean absolute error falling to 14.03 micrograms per cubic meter and the root mean square error to 17.65 micrograms per cubic meter.
The authors interpret this improvement as evidence that the method performs best where local-source influence is weakest, which is precisely the condition under which a background estimate should be most reliable. In dense urban networks, individual monitors sit close to roads, industry, and other emission hotspots, so any background estimate will inevitably differ from what a given monitor records. The better performance at the background site therefore supports the framework’s central claim: that it isolates the regional component of pollution rather than reproducing local extremes.
Separating background from local pollution matters because regional background represents the floor of pollution that a city cannot remove through local controls alone, since it arrives from surrounding regions through transport and diffuse emissions. Quantifying that floor is essential for isolating the impact of local sources on air quality. Existing approaches, such as statistical clustering and spectral filtering, have a key limitation: they do not account for the spatial resolution needed to define background pollution, which is the gap this wavelet framework is designed to close.
The use of MERRA2 reanalysis data is also significant, because reanalysis products provide consistent, spatially continuous estimates of aerosol concentrations over large regions, rather than the sparse point measurements offered by ground networks. Combining such data with a method that explicitly respects spatial coherence allows background estimates to be produced as maps rather than isolated city-level values. As with any modeling study, the reported error statistics describe performance against specific benchmarks in specific locations, and the moderate agreement across the full Delhi network indicates that urban-scale application remains challenging. Nevertheless, the study demonstrates that wavelet-based analysis of reanalysis data can yield a physically interpretable, seasonally consistent picture of background PM2.5 across India, offering a new tool for disentangling regional transport from local emissions in one of the world’s most polluted airsheds.
Subject of Research: Estimating regional background PM2.5 concentrations in India using a wavelet-based signal processing framework applied to MERRA2 reanalysis data
Article Title: Estimating background PM2.5 concentrations using a wavelet-based convolution framework
Article References: Vikas, Biswal, A., Singh, V., Bhate, J., & Sinha, P. R. (2026). Estimating background PM2.5 concentrations using a wavelet-based convolution framework. Environmental Monitoring and Assessment, 198(11), Article 1256. https://doi.org/10.1007/s10661-026-16082-7
Image Credits: AI Generated
DOI: 10.1007/s10661-026-16082-7
Keywords: PM2.5, air pollution, wavelet transform, MERRA2 reanalysis, India, Indo-Gangetic Plain, background concentrations, long-range transport, GMM-HMM, signal processing, Delhi, Environmental Monitoring and Assessment
Cite Scienmag News
Russell Cooper. (October 26, 2026). Wavelet method maps India’s background PM2.5 pollution from reanalysis data. Scienmag. https://scienmag.com/wavelet-method-maps-indias-background-pm2-5-pollution-from-reanalysis-data/
Russell Cooper. "Wavelet method maps India’s background PM2.5 pollution from reanalysis data." Scienmag, 26 October 2026, https://scienmag.com/wavelet-method-maps-indias-background-pm2-5-pollution-from-reanalysis-data/. Accessed 16 November 2026.
Russell Cooper. "Wavelet method maps India’s background PM2.5 pollution from reanalysis data." Scienmag. October 26, 2026. https://scienmag.com/wavelet-method-maps-indias-background-pm2-5-pollution-from-reanalysis-data/




