


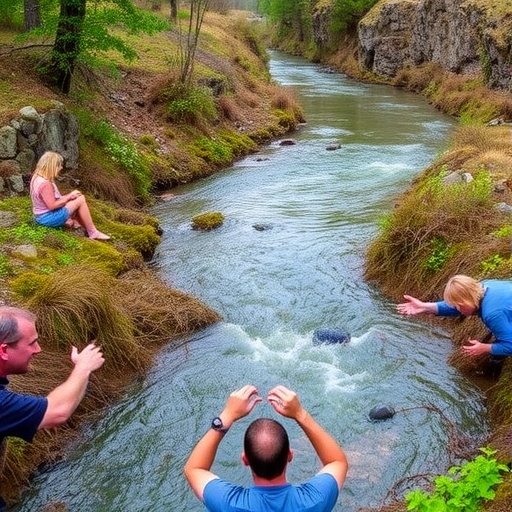
For more than a century, scientists, public agencies and local authorities have collected water samples from rivers across the United States. Each bottle represented a small measurement of a much larger environmental story: how landscapes, cities, farms, industries and climate have changed the chemistry of flowing water. A new study, published in Communications Earth & Environment, brings this fragmented record together, examining the history of water-quality sampling in American rivers and revealing why the nation’s environmental memory is both extraordinarily valuable and scientifically complex.
The research, led by N. Fernandez, G. Zuccolotto and L. V. Lucchese, focuses on the evolution of river monitoring rather than a single pollutant or watershed. Its subject is the sampling system itself: where measurements were made, when they were collected, which substances were analyzed and how monitoring priorities shifted over time. That perspective matters because water-quality records are not neutral time series. They are shaped by political decisions, technological advances, public health crises, industrial development and the changing ability of scientists to detect contaminants at very low concentrations.
A century ago, river sampling was often designed around visible pollution and basic chemistry. Investigators might measure temperature, acidity, suspended sediment, dissolved oxygen or the concentration of major ions. These parameters remain fundamental because they describe the physical and chemical conditions that determine whether aquatic organisms can survive. Dissolved oxygen, for example, is consumed when microorganisms break down organic material. When oxygen levels fall too far, fish and invertebrates can experience severe physiological stress or die, producing the familiar phenomenon known as hypoxia.
As analytical technology improved, the definition of water quality expanded. Laboratories gained the ability to detect nutrients such as nitrogen and phosphorus, toxic metals, pesticides, industrial chemicals, pharmaceuticals and other emerging contaminants. Modern instruments can identify substances at concentrations measured in parts per billion or even parts per trillion. Yet more sensitive technology also creates a challenge for long-term comparisons: a chemical that appears to be “absent” in an old record may simply have been below the detection limit of the equipment used at the time.
This issue of detectability is central to interpreting historical environmental data. Scientists must distinguish between a true decline in contamination and a change in laboratory methods. Statistical techniques can help by accounting for censored observations, inconsistent sampling intervals and differences in analytical protocols. In a censored dataset, a result is not recorded as an exact concentration but as a value below or above a detection threshold. Treating every “non-detect” as zero can seriously distort trends, particularly when monitoring sensitivity changes across decades.
The geography of sampling is equally important. Rivers near major cities, industrial centers, drinking-water intakes and pollution sources have traditionally received more attention than remote streams. This means a national database may contain thousands of observations, but those observations are not distributed evenly across the country. A heavily monitored urban river can dominate the historical record, while an ecologically important rural watershed may have only a handful of measurements. Any attempt to describe national water-quality change must therefore address spatial bias as carefully as temporal variation.
Sampling frequency can also alter the story. Monthly or quarterly measurements may capture broad seasonal patterns, but they can miss short-lived pollution events caused by heavy rainfall, agricultural runoff, sewer overflows or accidental releases. A river can appear clean under ordinary conditions and experience dramatic contamination during a storm. Continuous sensors, automated samplers and satellite observations now make it possible to observe some of these rapid changes, but such tools were unavailable for most of the twentieth century.
The historical record nevertheless offers an unprecedented opportunity. Long-term datasets allow researchers to connect water chemistry with major transformations in American society, including urban expansion, dam construction, industrialization, agricultural intensification and environmental regulation. They can also help evaluate whether improvements in wastewater treatment and pollution control have translated into measurable ecological benefits. In the United States, landmark environmental policies introduced during the twentieth century helped reduce several forms of conventional pollution, but the recovery of rivers has been uneven and new contaminants continue to emerge.
By assembling and examining a century of sampling activity, the study highlights a point that is easy to overlook: knowing how rivers changed requires knowing how they were observed. Monitoring networks are not merely passive instruments recording nature. They are evolving systems that reflect scientific priorities and public concerns. A rise in measurements of a particular contaminant may signal worsening pollution, heightened awareness, a new regulation or a cheaper analytical method. Conversely, a decline in sampling may create the illusion that a problem has disappeared when the surveillance itself has weakened.
The work arrives as water quality faces increasingly complicated pressures. Climate change is altering river temperature, flow regimes and the timing of runoff, while extreme storms can mobilize nutrients, sediments and pollutants across entire watersheds. Population growth and new industrial activities are introducing additional chemical mixtures into aquatic environments. A century-scale perspective can help scientists and policymakers identify genuine trends, recognize gaps in the monitoring network and design future programs that are more consistent, more spatially representative and better equipped to detect sudden events. The most important message is not simply that rivers have been sampled for 100 years, but that every measurement carries a history—and that understanding that history is essential for protecting the water on which ecosystems and communities depend.
Cite Scienmag News
Violet Maxwell. (August 4, 2026). U.S. Rivers Reveal a Century of Water Quality Monitoring. Scienmag. https://scienmag.com/u-s-rivers-reveal-a-century-of-water-quality-monitoring/
Violet Maxwell. "U.S. Rivers Reveal a Century of Water Quality Monitoring." Scienmag, 4 August 2026, https://scienmag.com/u-s-rivers-reveal-a-century-of-water-quality-monitoring/. Accessed 3 September 2026.
Violet Maxwell. "U.S. Rivers Reveal a Century of Water Quality Monitoring." Scienmag. August 4, 2026. https://scienmag.com/u-s-rivers-reveal-a-century-of-water-quality-monitoring/


