Adults with type 2 diabetes and diabetic kidney disease can be sorted into three distinct clinical phenotypes using only routinely collected baseline data, and those phenotypes carry markedly different risks of kidney disease progression, according to a retrospective real-world cohort study published in Diabetology & Metabolic Syndrome.
The study included 6,667 adults with type 2 diabetes and diabetic kidney disease. Rather than grouping patients by a single laboratory measure, the researchers used outcome-blind partitioning around medoids, an unsupervised clustering method, applied to 11 routinely available baseline variables. Reproducibility was tested with repeated subsampling and consensus clustering across multiply imputed datasets, and the analysis was performed without reference to future kidney outcomes, so the groupings emerged purely from patients’ clinical characteristics.
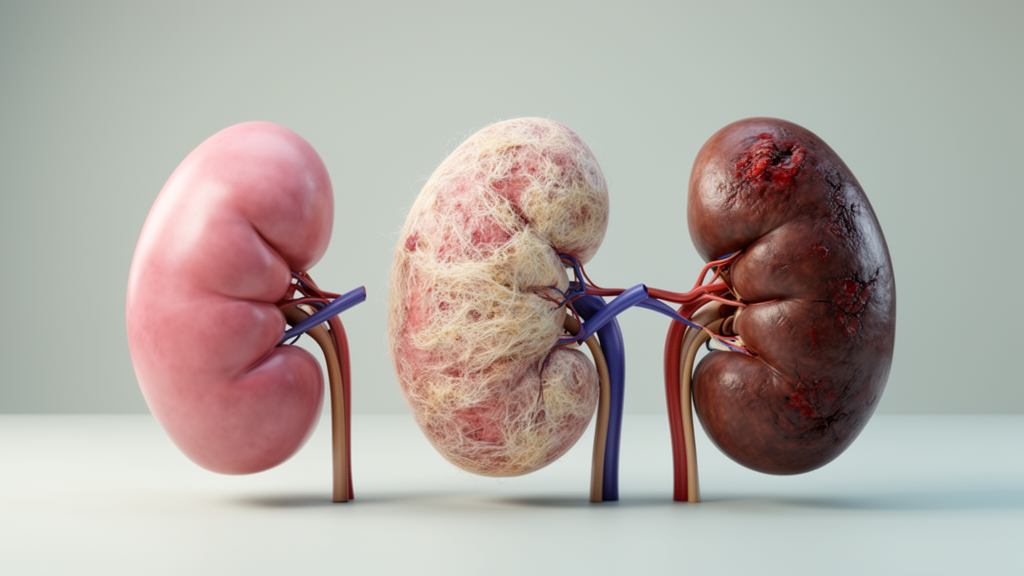
Three phenotypes emerged. The largest group, P1, was characterized as metabolic with preserved kidney function and contained 3,797 patients. P2, with 1,947 patients, was described as older, leaner, and with lower estimated glomerular filtration rate. P3, the smallest group at 923 patients, showed albuminuric renal impairment, combining reduced kidney filtration with elevated protein loss in the urine.
The prognostic differences between the groups were substantial. Among 2,651 patients included in the time-to-event analysis, 546 experienced the composite kidney outcome during follow-up. Compared with the metabolic, preserved-function group, the adjusted hazard ratio for the composite kidney outcome was 1.89 (95% CI, 1.50–2.37) for the older, lower-eGFR phenotype and 8.12 (95% CI, 6.54–10.07) for the albuminuric renal impairment phenotype.
Longitudinal trajectories of estimated glomerular filtration rate, tracked with linear mixed-effects models, told a consistent story. The adjusted annual eGFR slopes were −4.94, −3.80, and −9.14 mL/min/1.73 m² per year for P1, P2, and P3, respectively. The albuminuric phenotype thus lost filtration function at roughly twice the annual rate of the other two groups, while the older, leaner, lower-eGFR group started from a lower baseline but declined somewhat more slowly than the metabolic group.
A key finding concerns how the new phenotypes relate to existing clinical classification. The researchers examined heterogeneity within the category combinations of glomerular filtration rate and albuminuria defined by Kidney Disease: Improving Global Outcomes (KDIGO). All 15 KDIGO category combinations contained more than one of the data-driven phenotypes, meaning that patients who look identical under the standard two-dimensional classification can still differ in their broader clinical profile.
That overlap had prognostic consequences. After stratification by KDIGO category combination, so that patients were compared only with others in the same standard category, the adjusted hazard ratios were 1.35 (95% CI, 1.03–1.79) for P2 and 2.35 (95% CI, 1.70–3.26) for P3, relative to P1. In other words, even among patients sharing the same KDIGO filtration and albuminuria category, the multidimensional phenotypes still identified subgroups with meaningfully different risks of the composite kidney outcome.
The authors conclude that outcome-blind clustering identified three diabetic kidney disease phenotypes with distinct kidney outcome risks and longitudinal eGFR trajectories, and that multidimensional clinical phenotyping may complement KDIGO classification. Because the phenotypes were derived from variables already collected in routine care, the approach could in principle be applied without additional testing, although the findings come from a single retrospective cohort and the study was published as a peer-reviewed accepted manuscript that is subject to further edits before the final version of record.
For clinicians managing the large and growing population of people with type 2 diabetes and kidney involvement, the study suggests that looking beyond filtration rate and albuminuria alone—incorporating age, body composition, and other routine baseline characteristics—may help identify which patients face the steepest risk of progression and warrant closer monitoring and individualized management.
Subject of Research: Data-driven phenotyping of diabetic kidney disease and its association with kidney disease progression
Article Title: Data-driven clinical phenotypes of diabetic kidney disease and their association with disease progression: a real-world cohort study
Article References: He, J., Ma, J., Qu, H., Li, Y., You, D., & Fan, W. (2026). Data-driven clinical phenotypes of diabetic kidney disease and their association with disease progression: a real-world cohort study. Diabetology & Metabolic Syndrome. https://doi.org/10.1186/s13098-026-02324-8
Image Credits: AI Generated
DOI: 10.1186/s13098-026-02324-8
Keywords: diabetic kidney disease, type 2 diabetes, phenotyping, cluster analysis, eGFR trajectory, albuminuria, KDIGO classification, kidney outcomes, cohort study, risk stratification, chronic kidney disease, Data-driven
Cite Scienmag News
Jerry Hayes. (October 29, 2026). Three diabetic kidney disease phenotypes reveal sharply different risks of kidney decline. Scienmag. https://scienmag.com/three-diabetic-kidney-disease-phenotypes-reveal-sharply-different-risks-of-kidney-decline/
Jerry Hayes. "Three diabetic kidney disease phenotypes reveal sharply different risks of kidney decline." Scienmag, 29 October 2026, https://scienmag.com/three-diabetic-kidney-disease-phenotypes-reveal-sharply-different-risks-of-kidney-decline/. Accessed 29 October 2026.
Jerry Hayes. "Three diabetic kidney disease phenotypes reveal sharply different risks of kidney decline." Scienmag. October 29, 2026. https://scienmag.com/three-diabetic-kidney-disease-phenotypes-reveal-sharply-different-risks-of-kidney-decline/