Mount Etna, one of the most active volcanoes in the world, now has a new statistical description of how often its eruptions occur in time. A research team led by Laura Sandri of the Istituto Nazionale di Geofisica e Vulcanologia in Bologna, working with colleagues from the institute’s Catania observatory, has built separate temporal models for the volcano’s two main styles of activity: rare flank eruptions that open fissures on the volcano’s slopes, and the frequent paroxysmal eruptions from the summit craters. The work, published in the journal Natural Hazards and Earth System Sciences, shows that both styles of activity are best described by a renewal model known as the Brownian Passage Time, and demonstrates how these fitted models can feed directly into probabilistic assessments of volcanic hazard, including tephra fallout.
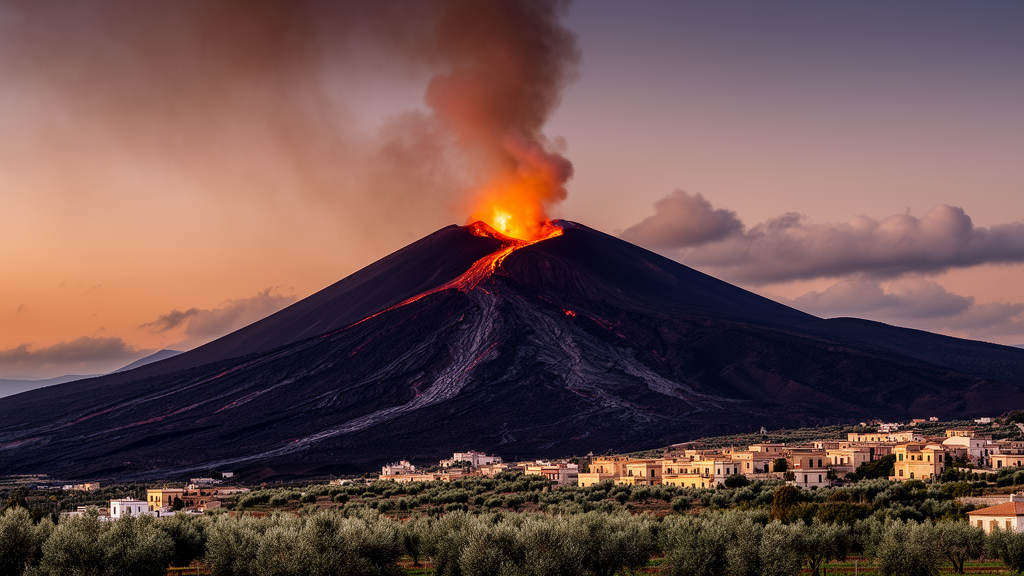
The distinction between the two eruption types matters because they behave very differently. Summit activity at Etna consists mostly of Strombolian activity and episodic lava fountains, or paroxysms, which are typically short-lived, lasting up to several hours, and frequent, occurring on average about seven times per year since 1986. These paroxysms produce eruptive plumes that can reach 17 to 18 kilometres above sea level, with total erupted masses reaching approximately ten to the power of ten kilograms. Flank eruptions, by contrast, are much rarer, averaging fewer than two events every ten years over the last four centuries, and involve lava effusion often accompanied by explosive activity that forms ash plumes, lasting from a few days to months. Because flank eruptions can send lava flows toward towns and villages on the volcano’s slopes and emit tephra over prolonged periods, they carry a different kind of risk profile than the frequent but brief summit events.
To model these two processes separately, the team first assembled two distinct catalogues of event start times. For flank eruptions, they drew on the flank eruptive fissures dataset reconstructed by Proietti and Branca in 2024, which selected mapped lava flows from the last 4000 years on the Etna New Geological Map and its updates, complemented by published compilations of Etna’s activity. Where several eruptive fissures had fed a single mapped lava flow, the system of fissures was catalogued as one event in time. For summit paroxysms, the researchers compiled a catalogue of 259 paroxysmal eruptions between September 1986 and February 2022, of which 242 were monitored. About 2 percent of these originated from the Bocca Nuova crater, 2 percent from the North-East crater, 6 percent from the Voragine and 90 percent from the South-East crater. The catalogue was assembled within the PANACEA project by merging previously published datasets and complementing them with information on paroxysms up to February 2023 from official bulletins and remote sensing data, prioritising radar-derived measurements where available.
A crucial step in any statistical eruption model is deciding how far back the record is complete. For flank eruptions, the team assumed stationarity and ran a change-point analysis on eruptions after the year 1000 CE, identifying a major change in eruption rate between the 1669 and 1763 eruptions. They therefore treated the flank eruption record as complete only after 1760 CE, cutting out an unusually long inter-event time that followed the largest eruption in 1669 CE, an event that destroyed the layout of Catania and may have disrupted the recording of subsequent eruptions. The researchers acknowledge that this long gap might be real and could reflect a time-predictable behaviour suggested by earlier studies, but they argue that it breaks the stationarity assumption their method requires. For summit paroxysms, they assumed the catalogue was complete from its first reported event in 1986, because monitoring has been continuous since then, supported by increasingly effective seismic and remote sensing systems.
With the catalogues established, the team computed inter-event times between successive onsets and tested the data for stationarity, temporal independence and clustering. The flank eruption inter-event times since 1760 proved to be independent, stationary, and to have a coefficient of variation below one, meaning the process is less variable than a Poisson process and tends toward more periodic behaviour, with no significant clustering. The team then fitted six renewal models commonly used in volcanology, the Exponential, Weibull, Gamma, Brownian Passage Time, LogNormal and LogLogistic distributions, and selected the best one using the Akaike Information Criterion and its small-sample corrected version. For flank eruptions, the Brownian Passage Time was consistently preferred. A bootstrapped Kolmogorov-Smirnoff test did not reject the model, with a p-value of 0.154 against a 90 percent confidence interval from bootstrapped samples of 0.069 to 0.218.
The summit paroxysms told a different story. Their coefficient of variation was far greater than one, and their cumulative number in time showed a clear tendency to cluster. Applying a k-means clustering algorithm and evaluating partitions with the mean Silhouette coefficient, the team found that the best partition divided the paroxysms into 12 clusters. They then modelled two separate sets of intervals: the inter-cluster times between the onsets of successive clusters, and the intra-cluster times between successive paroxysms within a cluster. Remarkably, both subsets were again best described by the Brownian Passage Time distribution, though with very different parameter values reflecting the different timescales involved.
Testing the compound summit model required a different approach. The researchers generated 4000 synthetic catalogues spanning 35 years, the same duration as the real record, by first sampling inter-cluster intervals from the fitted Brownian Passage Time distribution to place cluster onsets, then generating intra-cluster intervals within each cluster until an extremely long interval was drawn, defined as exceeding the 95th percentile of the intra-cluster distribution, which marks the cluster’s end. Synthetic catalogues in which clusters overlapped were discarded and resampled. These synthetic catalogues successfully reproduced key features of the real data: the distributions of the number of paroxysms over one, three and five year windows, their mean values, and the annual rates of both paroxysms and clusters. Kolmogorov-Smirnoff two-sample tests between real and pooled synthetic distributions did not reject the null hypothesis that both come from the same parent distribution, and individual tests against the 4000 synthetic catalogues produced only very few rejections.
The practical payoff of the models lies in hazard assessment. For flank eruptions, using the time elapsed since the last flank eruption as recorded in 2018, the model yields probabilities of an eruption over exposure windows of one, three, five, ten, thirty and fifty years, with 90 percent confidence intervals accounting for parameter uncertainty. Even at the lower limit of that interval, the probability of a flank eruption exceeds 95 percent over a thirty-year window. For summit paroxysms, the model gives an expected number of events over chosen time windows; the best estimate for one year is six paroxysms, with a 90 percent confidence interval stretching from zero to 28, a wide range that reflects the strongly clustered nature of the activity. The Brownian Passage Time model also outperformed a reference Poissonian occurrence for flank eruptions, showing a positive overall probability gain of 0.073, with the advantage concentrated in intervals longer than about one year but shorter than roughly six years since the previous event.
To show how the temporal model works in practice, the team built an illustrative probabilistic hazard assessment for tephra fallout from summit paroxysms. They pre-ran 3500 tephra dispersal simulations with the TEPHRA2 model, sampling random dates between 2007 and 2019 for which wind fields were available from daily weather data, and assigning each run eruption source parameters, the mass eruption rate and fallout duration, sampled from the empirical distributions of real observations. They then took 1000 synthetic catalogues of summit paroxysms, cut them over the period 2024 to 2048, and matched each synthetic event to the pre-simulated deposit closest in season, shifting years where necessary to preserve seasonality and the natural persistence of wind conditions within clusters. Combining the deposits on the simulation grid produced hazard curves for accumulated tephra at the ground during a single paroxysm, during a cluster, and over windows of one, three and five years, which can be cut at chosen load or probability thresholds to yield probability maps. The authors present this as an example of how the temporal model enables probabilistic volcanic hazard assessment for tephra fallout over different time windows while accounting for the uncertainty in when summit paroxysms will occur, a capability they argue can sharpen hazard planning for a volcano whose plumes threaten both local mobility, by dusting roads with tephra, and the air traffic around Sicily.
Subject of Research: Statistical temporal modelling of flank eruptions and clustered summit paroxysms at Mount Etna for probabilistic volcanic hazard assessment
Article Title: Temporal models for the occurrence of Etna eruptions and implications for hazard assessment
Article References: Sandri, L., Garcia, A., Scollo, S., Mereu, L., & Prestifilippo, M. (2026). Temporal models for the occurrence of Etna eruptions and implications for hazard assessment. Natural Hazards and Earth System Sciences, 26(10), 5151-5165. https://doi.org/10.5194/nhess-26-5151-2026
Image Credits: AI Generated
DOI: 10.5194/nhess-26-5151-2026
Keywords: Mount Etna, volcanic hazard, renewal models, Brownian Passage Time, summit paroxysms, flank eruptions, tephra fallout, inter-event times, cluster analysis, probabilistic hazard assessment, Sicily, eruption forecasting
Cite Scienmag News
Violet Maxwell. (October 28, 2026). Statistical Clocks for Mount Etna: New Models Quantify Eruption Odds. Scienmag. https://scienmag.com/statistical-clocks-for-mount-etna-new-models-quantify-eruption-odds/
Violet Maxwell. "Statistical Clocks for Mount Etna: New Models Quantify Eruption Odds." Scienmag, 28 October 2026, https://scienmag.com/statistical-clocks-for-mount-etna-new-models-quantify-eruption-odds/. Accessed 30 October 2026.
Violet Maxwell. "Statistical Clocks for Mount Etna: New Models Quantify Eruption Odds." Scienmag. October 28, 2026. https://scienmag.com/statistical-clocks-for-mount-etna-new-models-quantify-eruption-odds/