

Australia’s deep interior has just come into sharper focus. Researchers have unveiled AusMMER, the Australian Multiscale Model of Electrical Resistivity, a new three-dimensional resistivity model covering the entire Australian subcontinental lithosphere. It is the first continent-wide 3D resistivity model of Australia built from full magnetotelluric data, and it spans the crust, the lithospheric mantle and the uppermost asthenosphere in a single coherent image.
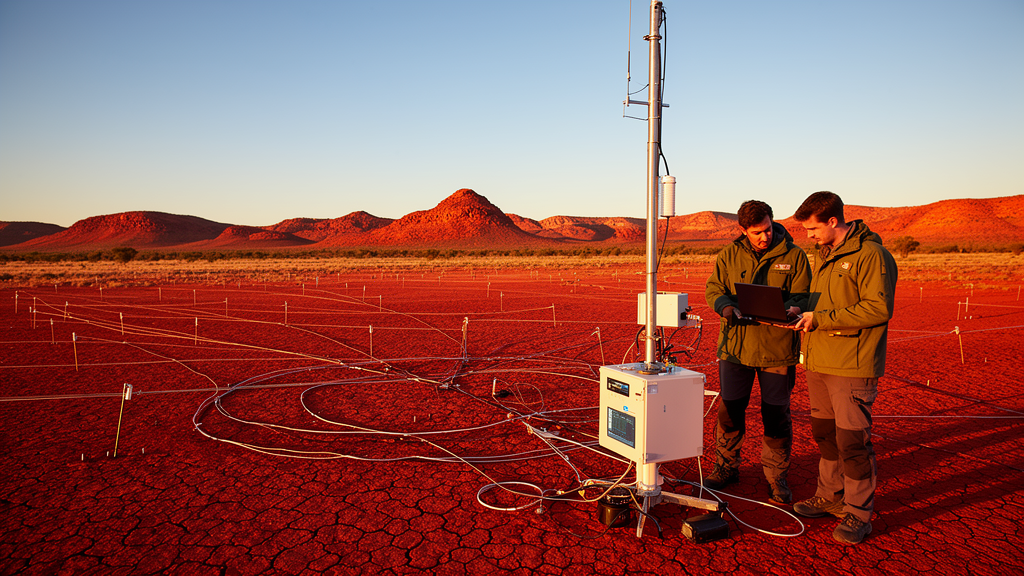
The model, described in an Express Letter in the journal Earth, Planets and Space, was produced by jointly inverting magnetotelluric responses from the AusLAMP and state arrays, geomagnetic responses from observatories, and legacy data from the Australia-Wide Array of Geomagnetic Stations, or AWAGS. In total, the team inverted plane-wave transfer functions from 1,394 magnetotelluric sites and 60 geomagnetic stations at periods between 10 and 10,000 seconds. Those periods correspond to investigation depths ranging from a few kilometres down to hundreds of kilometres within the Earth.
The technical backbone of the study is a distributed 3D finite-element electromagnetic solver that operates directly in the spherical frame and supports multiscale, locally refined meshes. The forward mesh contains roughly 1.5 million cells, while the inversion mesh holds about 337,817 cells, with the smallest cell diameter on the order of one kilometre near observation sites and the coastline. This discretisation allows accurate treatment of coast effects and highly heterogeneous station spacing while keeping the inverse problem computationally tractable. Laterally varying ocean and marine sediment conductance was fixed in the near-surface model, since it is required to reproduce transfer functions at coastal sites.
The data themselves come from several decades of acquisition. The AusLAMP project, a national collaboration between federal, state and territory geological agencies and research organisations launched in late 2013, aims to collect long-period magnetotelluric data at roughly 3,000 sites with half-degree spacing of about 55 kilometres. Measurements have so far been collected at approximately 1,500 sites, with acquisition complete in Victoria, New South Wales, South Australia and Tasmania and still ongoing in the Northern Territory, Queensland and Western Australia. The present study used 1,394 sites, including 1,354 AusLAMP stations plus legacy long-period sites, distributed across much of mainland Australia and Tasmania.
To these were added geomagnetic observations of a very different vintage. AWAGS operated between November 1989 and December 1990 with 57 three-component magnetometers across mainland Australia; usable transfer functions were obtained at 54 of those locations. Six permanent observatories maintained by Geoscience Australia through the INTERMAGNET network supplemented them. Vertical magnetic transfer functions were estimated at 15 periods from roughly 360 to 6,000 seconds, a band in which the plane-wave source approximation is appropriate for lithosphere-scale imaging. The final joint dataset contained 268,223 real-valued observations, fitting phase tensors and induction vectors, which are dimensionless transfer functions free of galvanic distortion effects.
The inversion converged from an initial normalised root-mean-square error of 5.42 to a final value of 1.74 after 31 Gauss-Newton iterations. The authors report that the final model fits both phase tensor and induction vector data well, with the best agreement at intermediate periods; larger residuals remain at the shortest periods and at a limited number of coastal and isolated inland sites, most likely reflecting unresolved shallow heterogeneity, complex coast effects and weaker constraints where only geomagnetic transfer functions exist. Resolution is markedly higher within the footprint of the AusLAMP coverage, which now spans more than half the continent, and the model represents a significant advance over the previous continent-wide model derived from geomagnetic data alone, whose roughly 300-kilometre station spacing limited its resolution.
The imaged anomalies align closely with major tectonic units and their boundaries. At shallow levels the model coherently maps sedimentary cover despite the roughly 50-kilometre site spacing: the Officer, Eromanga and Amadeus basins in Central Australia appear as low-resistivity zones, typically below 10 ohm-metres. At upper to mid-crustal depths, the Gawler, Yilgarn and North Australian cratons stand out as generally resistive, while crustal conductors form narrow, elongated features aligned with major tectonic boundaries. Arcuate conductive margins flank the Gawler craton through the entire crustal column, signatures that the authors link to magma and fluid focusing during the Proterozoic that led to the emplacement of Iron Oxide Copper Gold deposits around 1590 million years ago.
Perhaps the most striking results emerge at mantle depths. Below about 100 kilometres, mantle resistivity appears decoupled from the crust, showing longer-wavelength variations. In eastern Australia, resistivity drops to a few tens of ohm-metres at 185 kilometres depth, attributed to partial melts and higher temperatures, consistent with regional interpretations of upwelling and melting beneath Cenozoic volcanic provinces; this reduced resistivity broadly aligns with reduced shear-wave velocities from the global seismic tomography model REVEAL. In the central and western continent, where the 125 and 185-kilometre depth slices still lie within the subcontinental lithospheric mantle, the model shows significant localised resistivity variations despite only subtle seismic perturbations. Enhanced conductivity in dry lithosphere is often associated with minor conducting phases such as hydrogen in nominally anhydrous mantle minerals, graphite, amphiboles or phlogopite, making resistivity a proxy for mantle metasomatism and enrichment in incompatible elements.
The model also forges a direct link to mineral exploration. The 170-kilometre isoline of the lithosphere-asthenosphere boundary has previously been identified as significant for mineral potential in Australia and elsewhere, and AusMMER shows mantle conductors at similar depths coinciding with that step at the locations of major deposits, including the eastern edge of the Gawler craton, home to the world-class Olympic Dam deposit, and the Mount Isa Province in Queensland. While the Gawler mantle conductor was already well established in earlier work, the deeper resistivity footprint beneath Mount Isa, extending to the 170-kilometre boundary step, had not previously been demonstrated to the same degree. The authors suggest that co-located electrical mantle conductors may help differentiate regions where favourable lithospheric architecture shows fertility proxies through reduced resistivity. Beneath the Musgrave Province, moderately conductive east-west mantle structure coincides with crustal conductors from intracratonic deformation, near the Nepo-Babel nickel-sulfide PGE prospect, where recent high-pressure experiments on hydrous minerals point to their role in controlling nickel endowment.
The authors are careful to flag the model’s limits. Western Australia lacks AusLAMP coverage, so its structure rests on sparse legacy AWAGS data: the resistive Archean Yilgarn craton is clearly visible, but the Pilbara craton is poorly resolved owing to station spacing exceeding 300 kilometres. A pronounced mantle conductor northeast of the Pilbara at depths greater than roughly 125 kilometres, and anomalies near the Darling Fault and the western Eucla Basin margin, are each supported by only a handful of geomagnetic stations, leaving their geometry and magnitude uncertain until further deployments. Beyond solid Earth science, the model serves a practical purpose: 3D resistivity structure exerts first-order control on the geoelectric fields and geomagnetically induced currents generated during geomagnetic storms, so a nation-wide conductivity model capturing coastline effects and major conductors provides the baseline for quantifying space-weather impacts on power grids and pipelines. As AusLAMP coverage expands further into Western Australia, the model can be refined, promising an ever-clearer electrical portrait of the continent’s accretion history and its buried mineral wealth.
Subject of Research: A continent-scale 3D electrical resistivity model of the Australian lithosphere derived from joint inversion of magnetotelluric and geomagnetic data.
Article Title: The electrical resistivity model of the Australian lithosphere
Article References: Grayver, A., Thiel, S., Duan, J., Munch, F., & Heinson, G. (2026). The electrical resistivity model of the Australian lithosphere. Earth, Planets and Space, 78(1), Article 222. https://doi.org/10.1186/s40623-026-02550-4
Image Credits: AI Generated
DOI: 10.1186/s40623-026-02550-4
Keywords: magnetotellurics, electrical resistivity, Australian lithosphere, AusLAMP, geomagnetic depth sounding, mineral deposits, lithosphere-asthenosphere boundary, 3D inversion, geospace weather, crust and mantle, electrical, resistivity
Cite Scienmag News
Violet Maxwell. (October 30, 2026). Scientists Map Australia’s Lithosphere in Unprecedented Electrical Detail. Scienmag. https://scienmag.com/scientists-map-australias-lithosphere-in-unprecedented-electrical-detail/
Violet Maxwell. "Scientists Map Australia’s Lithosphere in Unprecedented Electrical Detail." Scienmag, 30 October 2026, https://scienmag.com/scientists-map-australias-lithosphere-in-unprecedented-electrical-detail/. Accessed 4 November 2026.
Violet Maxwell. "Scientists Map Australia’s Lithosphere in Unprecedented Electrical Detail." Scienmag. October 30, 2026. https://scienmag.com/scientists-map-australias-lithosphere-in-unprecedented-electrical-detail/