


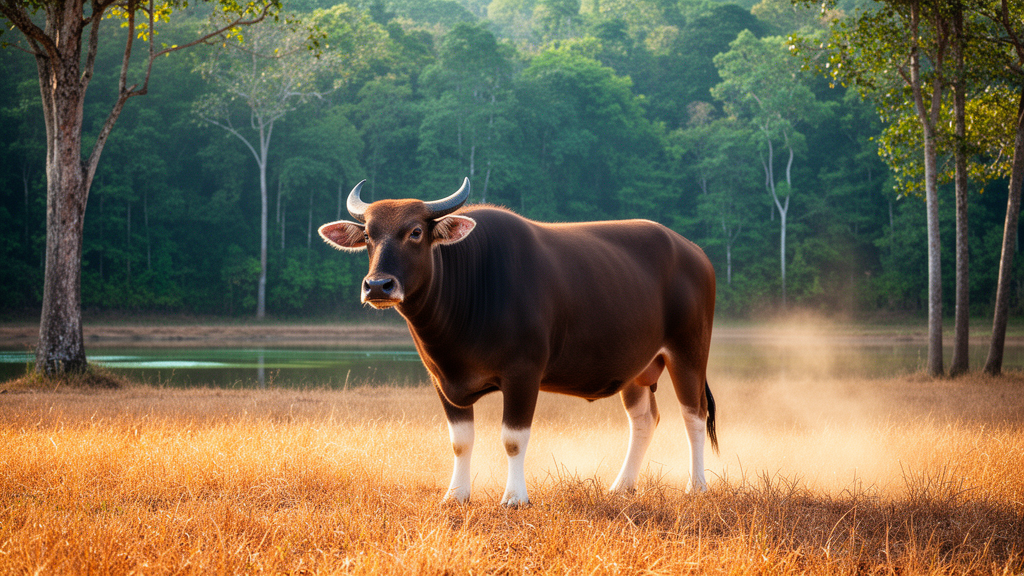
A one-year observational dung survey in western Thailand found moderate seasonal variation in banteng density across Huai Kha Khaeng Wildlife Sanctuary and its surrounding buffer zone, with mean density estimated at 2.54 ± 0.34 individuals per square kilometre. Density was highest in the late rainy season and lowest in the mid-rainy season, while proximity to the protected area was the only significant main predictor in the mixed-effects analysis.
The study covered the 173-square-kilometre Huai Thap Salao Watershed on the northeastern edge of Huai Kha Khaeng in Uthai Thani Province. The landscape included portions of Huai Kha Khaeng and the adjacent Huai Thap Salao–Huai Khok Khwai National Forest, an area functioning as a buffer around the protected landscape. Its seasonally dry forests were dominated by mixed deciduous forest with bamboo, deciduous dipterocarp forest and mixed deciduous forest. People also used the area for grazing cattle, water buffalo, goats and sheep and for collecting bamboo shoots from May through October and termite mushrooms from October through November.
Because dense vegetation and limited visibility can make direct distance sampling unreliable, researchers used repeated indirect dung surveys. They established 130 strip transects at 840-metre intervals, with one 5-metre-wide transect in each 210-by-210-metre grid cell and an effective sampled area of approximately 4,100 square metres per transect. Seven survey periods covered October 2018 through September 2019. Only dung estimated to be less than 30 days old was recorded, and piles were removed after each survey period to standardise accumulation.
Density was estimated with an equal-probability strip-transect method. The calculation used an assumed defecation rate of 9.5 dung piles per banteng per individual per day, based on earlier observations. Mixed-effects models with negative-binomial errors examined associations with distances to protected areas, livestock-grazing zones, agricultural and horticultural areas, and non-timber forest product collection areas, while accounting for survey period and plot. Additional period-specific models compared habitat, environmental and human-use variables using Akaike information criteria corrected for small sample size.
Mean density reached 2.94 ± 0.56 individuals per square kilometre in October–November 2018, then declined to 2.66 ± 0.33 in December–January and 2.57 ± 0.35 in January–February. It rose to 2.75 ± 0.27 during February–April before falling to 2.46 ± 0.42 in April–May and 2.00 ± 0.21 in May–August. The April–May estimate was significantly lower than the early- and late-dry-season estimates in pairwise comparisons, both with p-values below 0.05. Density then rose slightly to 2.41 ± 0.28 in August–September.
Habitat use also varied by season. Mixed deciduous forest had the highest overall densities, including 5.08 ± 0.36 individuals per square kilometre in October–November. Deciduous dipterocarp forest densities increased during the dry season, whereas mixed deciduous forest with bamboo reached its highest density in August–September. Open areas in the buffer had an elevated estimate of 4.08 ± 2.44 individuals per square kilometre in January–February, with lower estimates in the other periods. These results measure redistribution among habitats rather than changes in the number of animals present.
Comparisons between locations inside and outside the protected-area boundary found no significant difference from January through April. Density was higher inside the protected area in October–November, December–January, April–May and May–August, with reported p-values of 0.03, 0.04, 0.01 and 0.03, respectively; the December–January contrast fell in the early dry season. In the mixed-effects analysis, the incidence rate ratio for distance from the protected area was 0.68, indicating an estimated 32% decrease in density for each unit increase in that distance. Distances from non-timber forest product zones, livestock areas, agricultural areas and horticultural areas had weak, statistically non-significant main associations with density.
Relationships with human land use varied over time. In January–February, the period-specific model associated greater distance from livestock areas with higher banteng density, while the direction of the relationship with non-timber forest product collection differed among periods. In April–May, when livestock use was intensive, banteng density within livestock zones was significantly lower than outside them, with a p-value below 0.01. No significant difference between areas with and without livestock was detected in January–February. The authors interpreted overlap with some harvesting areas as potentially reflecting attraction to concentrated resources, but the observational analysis did not establish the cause.
The findings are limited by monitoring across one annual cycle, restriction to lowland habitats in a single watershed and reliance on an assumed defecation rate that may vary across seasons and ecological conditions. Prescribed burning occurred from 22 February to 10 March 2019, after which wildfires affected all 130 transects. This enabled assessment of landscape-wide post-fire conditions but prevented comparison between burned and unburned patches. The researchers proposed seasonally targeted buffer-zone management, including controls on livestock access and harvesting and closer coordination with local communities, but the study did not test the effects of those interventions.
Subject of Research: Seasonal banteng density and habitat use in a protected-area buffer landscape in western Thailand
Article Title: Seasonal variation in banteng density and habitat use across protected areas and buffer zones in western Thailand
Article References: Chookaew, N., Phumsathan, S., Simcharoen, A., Duangchantrasiri, S., & Pongpattananurak, N. (2026). Seasonal variation in banteng density and habitat use across protected areas and buffer zones in western Thailand. Nature Conservation, 64, 1-26. https://doi.org/10.3897/natureconservation.64.184399
Image Credits: AI Generated
DOI: 10.3897/natureconservation.64.184399
Keywords: banteng, population density, dung surveys, seasonal variation, habitat use, protected areas, buffer zones, livestock grazing, Thailand, conservation, Seasonal, variation
Cite Scienmag News
Margaret Porter. (October 20, 2026). One-year dung survey finds seasonal banteng density shifts in western Thailand. Scienmag. https://scienmag.com/one-year-dung-survey-finds-seasonal-banteng-density-shifts-in-western-thailand/
Margaret Porter. "One-year dung survey finds seasonal banteng density shifts in western Thailand." Scienmag, 20 October 2026, https://scienmag.com/one-year-dung-survey-finds-seasonal-banteng-density-shifts-in-western-thailand/. Accessed 20 October 2026.
Margaret Porter. "One-year dung survey finds seasonal banteng density shifts in western Thailand." Scienmag. October 20, 2026. https://scienmag.com/one-year-dung-survey-finds-seasonal-banteng-density-shifts-in-western-thailand/


