


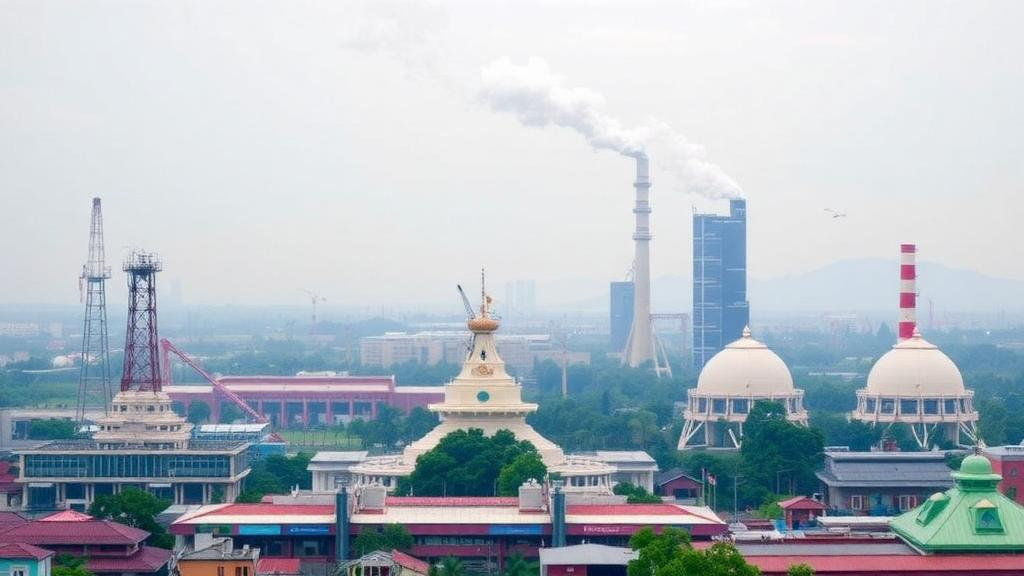
A textile factory in Central Java can pass every national air quality test on the books and still leave the people living around it breathing air that falls short of what global health scientists consider safe. That uncomfortable gap between legal compliance and genuine health protection sits at the heart of a new study published in Environmental Science and Pollution Research, in which Slamet Isworo and Poerna Sri Oetari of Universitas Dian Nuswantoro in Semarang present a framework that fuses classical pollutant dispersion modeling with a health-weighted index of atmospheric pressure. Their goal is deceptively simple: to translate the raw output of industrial emission models into a single number that tells regulators, companies, and communities how much cumulative pressure a facility actually places on the air its neighbors breathe.
The technical backbone of the framework is the Gaussian plume model, a workhorse of atmospheric science that has been used for decades to estimate how pollutants spread downwind from a source. The model treats a smokestack or vent as an emitting point and calculates concentration at any receptor location as a function of emission rate, stack height, wind speed and direction, and atmospheric stability, producing a characteristic bell-shaped concentration footprint that widens with distance. In this study, the authors coupled that dispersion calculation with an emission inventory for a textile manufacturing facility in Central Java, drawing on a decade of ERA5 reanalysis meteorological data covering 2015 through 2024 to capture the real wind and stability conditions that shape pollutant transport across the landscape.
What distinguishes the work from a standard dispersion study is the second layer of the analysis: the Atmospheric Environmental Pressure Index, or AEPI. Rather than comparing each pollutant concentration directly against a limit, the framework normalizes modeled concentrations using hazard quotients, a concept borrowed from human health risk assessment. A hazard quotient expresses the ratio of an estimated exposure to a reference level considered unlikely to cause harm, so a pollutant that is toxic at low concentrations contributes more to the index than a relatively benign one at the same airborne level. Summing these weighted contributions yields a single cumulative score of environmental pressure, allowing pollutants with very different chemistry and toxicity to be compared on a common, health-oriented scale.
The study validated its modeled predictions against ambient measurements taken at six receptor locations around the facility, giving the framework an empirical anchor rather than relying on simulation alone. The results tell a story that will resonate far beyond one Indonesian factory. Predicted concentrations of the modeled pollutants complied with Indonesia’s National Ambient Air Quality Standards established under Government Regulation No. 22 of 2021, which is precisely the kind of finding that would normally close the book on regulatory scrutiny. Yet when the same concentrations were benchmarked against the World Health Organization’s 2021 global air quality guidelines, fine particulate matter, or PM2.5, exceeded the recommended values.
That divergence is the crux of the paper’s message. National standards and WHO guidelines are built for different purposes and often embody different tolerances for risk, and a facility can sit comfortably within the former while contributing to conditions that the latter identifies as harmful. Fine particles smaller than 2.5 micrometers are particularly consequential because they penetrate deep into the lungs and enter the bloodstream, and the WHO tightened its guideline values in 2021 precisely because the accumulated epidemiological evidence linked even low-level exposure to cardiovascular and respiratory disease. A compliance-only assessment, the authors argue, can therefore paint a misleadingly reassuring picture of industrial air quality.
The AEPI numbers themselves place the facility in the mildest category the index defines. The baseline atmospheric pressure score was 0.06, the model-predicted score was 0.08, and the incremental contribution attributable to the facility amounted to 0.02, all falling within the very low atmospheric pressure category. Within that small number, however, the composition matters: particulate matter, both PM2.5 and the coarser PM10 fraction, emerged as the dominant contributor to the index. In other words, even where total pressure is low, the framework identifies which pollutants drive it, giving regulators a prioritized target for emission controls rather than a flat list of parameters to monitor.
The authors are careful about scope. They explicitly state that the aim is not broad generalization but the demonstration of a transferable modeling and indexing framework, one that can be applied predictively and in settings where monitoring data are scarce. That limitation-aware framing is significant for industrializing regions across Southeast Asia and beyond, where dense networks of regulatory-grade monitors are rare and where environmental impact assessments often depend on sparse, point-in-time measurements. A framework that combines a decade of freely available reanalysis meteorology, a facility-level emission inventory, and a modest number of ground receptors offers a pragmatic path to health-informed assessment where conventional approaches struggle.
The methodological lineage of the framework is visible in its components. The Gaussian plume approach underpins widely used regulatory models such as AERMOD, maintained by the United States Environmental Protection Agency, and remains popular because it is computationally cheap, transparent, and interpretable in a way that more complex chemical transport models are not. The hazard quotient normalization traces to the risk assessment guidance developed for hazardous waste sites, where exposure estimates are routinely divided by toxicity reference values to screen for potential harm. By grafting that risk arithmetic onto dispersion output, the researchers effectively build a bridge between two communities, air quality modelers and health risk assessors, that often publish in parallel rather than in concert.
The broader implications reach into policy design. If a country’s ambient standards are looser than WHO guidelines, then a regulatory regime built solely on compliance checking will systematically undercount the health burden of industrial activity, particularly the chronic, low-level exposure that accumulates across years. Indices like the AEPI do not replace standards, but they add a second lens, one that can flag facilities whose emissions are legally permissible yet health-relevant, and they can be recalibrated as guideline values evolve. The study’s finding that particulate matter dominates the index even at very low overall pressure also aligns with a growing global consensus that PM2.5 is the pollutant to watch in industrial airsheds.
For the residents near the Central Java facility, the practical takeaway is nuanced but not alarming: the factory’s contribution to atmospheric pressure is real, measurable, and small, yet the air they share with it does not meet the most health-protective international benchmarks for fine particles. For the scientific and regulatory community, the takeaway is more structural. The study shows that it is feasible, with publicly available meteorological data and a modest measurement campaign, to move from the binary language of compliance and violation toward a graded, health-weighted description of industrial environmental pressure. As textile manufacturing continues to expand across Indonesia and comparable economies, frameworks of this kind may become an essential tool for ensuring that the air around factories is judged not just by what the law allows, but by what human health can tolerate.
Subject of Research: Health-based industrial air quality assessment using Gaussian plume dispersion modeling and the Atmospheric Environmental Pressure Index
Article Title: A risk-integrated framework for industrial air quality assessment linking dispersion modeling and health-based environmental pressure indicators
Article References: Isworo, S., & Oetari, P. S. (2026). A risk-integrated framework for industrial air quality assessment linking dispersion modeling and health-based environmental pressure indicators. Environmental Science and Pollution Research, 33(27), 13904-13922. https://doi.org/10.1007/s11356-026-38159-z
Image Credits: AI Generated
DOI: 10.1007/s11356-026-38159-z
Keywords: air quality, Gaussian plume model, dispersion modeling, PM2.5, hazard quotient, Atmospheric Environmental Pressure Index, textile industry, Indonesia, WHO air quality guidelines, health risk assessment, environmental pressure, industrial emissions
Cite Scienmag News
Russell Cooper. (October 13, 2026). New Health-Weighted Air Quality Index Reveals Hidden Risks of Industrial Pollution in Indonesia. Scienmag. https://scienmag.com/new-health-weighted-air-quality-index-reveals-hidden-risks-of-industrial-pollution-in-indonesia/
Russell Cooper. "New Health-Weighted Air Quality Index Reveals Hidden Risks of Industrial Pollution in Indonesia." Scienmag, 13 October 2026, https://scienmag.com/new-health-weighted-air-quality-index-reveals-hidden-risks-of-industrial-pollution-in-indonesia/. Accessed 13 October 2026.
Russell Cooper. "New Health-Weighted Air Quality Index Reveals Hidden Risks of Industrial Pollution in Indonesia." Scienmag. October 13, 2026. https://scienmag.com/new-health-weighted-air-quality-index-reveals-hidden-risks-of-industrial-pollution-in-indonesia/


