


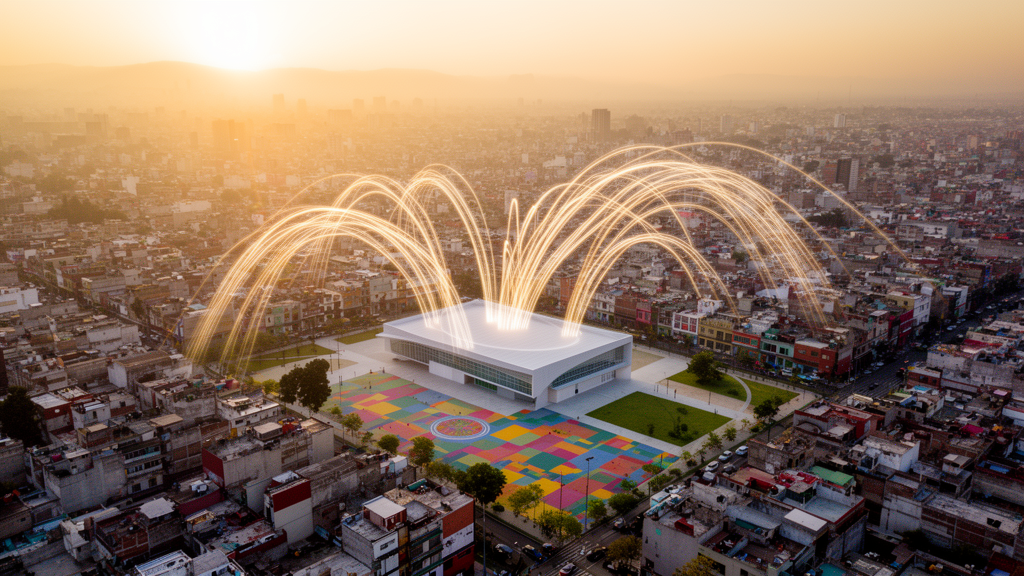
When a city builds a swimming pool, a planetarium or a community kitchen in a poor neighborhood, the investment only pays off if people actually show up. A team of researchers in Mexico and the United States has now measured, with unusual precision, who visits the Utopías of Iztapalapa, a network of thirteen free community centers on the eastern periphery of Mexico City, and their findings reveal a steep hierarchy of reach shaped by buses and trains, signature attractions and the geography of violent crime.
The Utopías are the flagship social program of Iztapalapa, a borough of nearly 1.8 million residents that combines the highest population density in Mexico City with some of its deepest deficits: only 5.4 square meters of green space per person, roughly a third of the best-served borough, and a poverty rate of 43.9 percent in 2020. Construction began in 2019, and each site offers a different mix of swimming pools, skateparks, climbing walls, science exhibits and care services, some pairing recreation with women’s health programs. Yet until now, no one had systematically measured who actually uses the network.
The study, published in Frontiers in Big Data, sidesteps the limitations of on-site surveys and entrance headcounts by analyzing six months of anonymized location-based services data, from late September 2023 to the end of March 2024. The researchers processed raw streams of smartphone pings, detecting stays of at least five minutes within a twenty-meter radius and clustering repeated visits into stable stop locations. Each device’s home was inferred from the stop it visited most often during residential hours, on at least fourteen distinct days, and matched to a census-derived wealth map dividing the metropolitan area into 5,648 residential cells.
Because no official boundary maps exist for the Utopías, the team reconstructed each site’s perimeter using the coordinates of WiFi access points installed at the facilities as anchors, tracing walls and fences in satellite imagery. They then characterized every site along three axes a government can observe before building anything: a distinctiveness index scoring the rarity and capital intensity of activities, a transit accessibility score built from GTFS data within a one-kilometer buffer, and the volume and violent share of crime from georeferenced prosecutor’s office records.
The results show a network sharply divided in scale. Two large, well-connected sites, Olini and Meyehualco, drew roughly 2,700 and 1,200 unique visitors respectively, together accounting for more than four in five of all recorded visits across the network’s 4,704 unique visitors. At the other extreme, sites like Papalotl, Tecoloxtitlan and Barco recorded only a handful of visitors each, though these smaller spaces maintained remarkably stable daily use by a small cohort of recurring locals. About fifty-five percent of visitors overall came from outside the host borough, but this metropolitan pull was almost entirely concentrated in the two largest hubs.
Transit connectivity emerged as the strongest predictor of visitor volume, correlating with log-scaled visitor counts at r = 0.64. The number of distinct transit routes and weekday trip frequency within a kilometer carried most of the signal, while a conventional distance-weighted accessibility index, the classic measure of potential access, showed no significant relationship with actual visitation. In other words, what matters is not how centrally a facility sits in the urban geography but whether buses, metro lines and colectivos can deliver people to it, a finding with obvious value since GTFS data are public and this screening can happen before a single facility is built.
What each site offers shaped a different outcome: not how many visitors arrive, but how far they travel. Sites with signature attractions such as a planetarium or a dinosaur park showed a large weekend distance premium, the extra distance weekend visitors cover compared with weekday visitors, with landmark attractions correlating at r = 0.91 with that premium. Everyday facilities like fitness rooms and team sports courts tracked higher visitor volume instead. Notably, the team found no association between a site’s overall offer and its attendance, suggesting signature infrastructure extends a site’s catchment rather than filling it.
Crime told a subtler story still. The total volume of recorded incidents around a site was essentially unrelated to visitation, but the violent share of that crime was strongly and negatively associated with visitor wealth (r = −0.75) and travel distance (r = −0.64). Facilities surrounded by more violent crime drew poorer, more localized catchments, a pattern the authors interpret cautiously as reflecting the overlapping geographies of violence and residential poverty rather than any causal effect on individual choices.
The study has clear limits. Location-based data under-represent the poorest residents, precisely the population the program targets, the panel is not disaggregated by sex, and with only thirteen sites every reported relationship is a correlation across a single six-month window. Still, the temporal signal offers something a one-time survey never could: visits grew steadily from October to a February peak, and the weekly cycle was nearly flat, showing the centers function as everyday weekday infrastructure rather than weekend destinations.
Crossing the two levers most directly under government control, the researchers produced a four-type typology: flagship destinations like Olini with both transit and unique attractions, connected neighborhood hubs, under-connected attractions, and plain neighborhood spaces serving their immediate surroundings. The team’s composite index tracked mean travel distance better than any single component, and their conclusion for planners is stark: infrastructure alone will not close the equity gap. Transport access, screenable from open data before any capital is committed, comes first among the levers any city can pull.
Subject of Research: Realized access and equity of the Utopías community centers in Iztapalapa measured with location-based mobility data
Article Title: Evaluating the reach and equity of public spaces in Mexico City using mobility data: the case of the Utopías in Iztapalapa
Article References: Langle-Chimal, O. D., Cadavid-Aguilar, N., Meouchi-Vélez, A., & Ponce-López, R. (2026). Evaluating the reach and equity of public spaces in Mexico City using mobility data: the case of the Utopías in Iztapalapa. Frontiers in Big Data, 9, Article 1942458. https://doi.org/10.3389/fdata.2026.1942458
Image Credits: AI Generated
DOI: 10.3389/fdata.2026.1942458
Keywords: human mobility data, location-based services, public space, social infrastructure, Mexico City, Iztapalapa, transit accessibility, urban equity, crime, GTFS, visitor catchments, segregation
Cite Scienmag News
Denise Maddox. (October 15, 2026). Mobility Data Reveal Who Really Reaches Mexico City’s Utopía Community Centers. Scienmag. https://scienmag.com/mobility-data-reveal-who-really-reaches-mexico-citys-utopia-community-centers/
Denise Maddox. "Mobility Data Reveal Who Really Reaches Mexico City’s Utopía Community Centers." Scienmag, 15 October 2026, https://scienmag.com/mobility-data-reveal-who-really-reaches-mexico-citys-utopia-community-centers/. Accessed 15 October 2026.
Denise Maddox. "Mobility Data Reveal Who Really Reaches Mexico City’s Utopía Community Centers." Scienmag. October 15, 2026. https://scienmag.com/mobility-data-reveal-who-really-reaches-mexico-citys-utopia-community-centers/


