

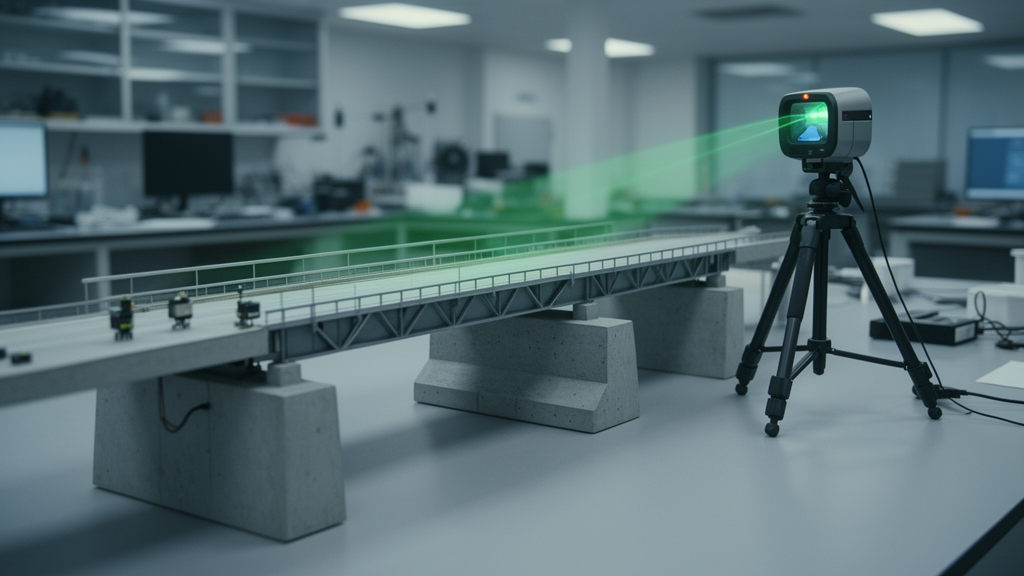
Engineers testing a scaled laboratory bridge have shown that a terrestrial laser scanner can track how an entire girder system deforms as its supports change, not just the movement at a handful of instrumented points. In a study published in Advances in Bridge Engineering, J. Vrabel Jr. and Adriana Trias Blanco compared LiDAR-derived deflections and support settlements against string potentiometers, a laser reference method, and reaction scales across eleven support configurations and three loading scenarios. The scanner matched the conventional instruments with an overall average deflection difference of 1.82 millimeters and captured settlement with average agreement of over 87 percent within a 5.00-millimeter threshold, corresponding to a maximum difference of 5.00 millimeters.
The motivation comes from a persistent gap in bridge monitoring. Traditional structural health monitoring relies on contact sensors or visual inspection, both of which sample the structure sparsely. Certified inspectors must physically assess every member of the more than 623,000 bridges in the United States, of which 55.8 percent are rated in fair or poor condition according to the 2025 ASCE Infrastructure Report Card; 348,257 bridges require attention and 42,000 need urgent intervention. With inspections conducted biannually and manpower limited, the researchers argue that a noncontact instrument capable of measuring the whole deformation field could flag bearing or support problems that single-point readings overlook.
The team built a model bridge from aluminum I-beams with a 1.91-centimeter plywood deck, resting on concrete masonry blocks that simulated abutments. Four girders, each supported at two points by individual concrete block columns, gave eight supports in total. To mimic deterioration, the researchers swapped supports between two states: wooden blocks approximating pins, and spring assemblies made of four conical springs sandwiched between thin steel plates. Eleven support configurations were tested, running from all pins in Test 0 to all springs in Test 10. A static vertical shaker applied a 791.78-newton point load at midspan between Girders 1 and 2, designated Location A, or between Girders 2 and 3, designated Location B, alongside an unloaded condition, producing 33 test settings.
A FARO Focus 150s terrestrial laser scanner, positioned roughly one meter from Girder 1 near the left support, captured the point clouds. The researchers imported the raw scans into Autodesk ReCap, segmented regions of interest, and extracted cross-sections at the left support, midspan, and right support of each girder, targeting the bottom flange as the measurement plane. Deflection was computed as the vertical displacement difference between the mean elevation at midspan and the average of the two support elevations. Each girder was processed five times per case, and the full campaign yielded 1,980 individual point clouds for deflection alone.
The volume of data forced a workflow innovation. A fully manual procedure, involving importing data, creating 60 cross-sections, exporting to Excel, and computing deflections, took about 90 minutes per test. A Python script written in Spyder automated file checks, standardized slice extraction, and batch processing, cutting the time to roughly 40 minutes per test. The script also generated a master results file and a secondary log with tabs for skipped trials, flagged outliers, and summaries, so that anomalous trials could be identified and excluded from averages without silently distorting the dataset.
Deflection agreement varied systematically by girder. Under unloaded conditions, the overall average difference between control and experimental values was 1.60 millimeters, with Girder 1 showing the highest average difference at 2.69 millimeters and Girder 3 the smallest at 1.05 millimeters. When the load sat at Location A, Girders 1 and 2 carried 53 percent of the overall deflection response and Girders 2 and 3 recorded 47 percent, and the largest single difference reached 6.36 millimeters on Girder 1 in Test 10. Loading at Location B reversed the distribution almost completely, with Girders 2 and 3 accounting for 56 percent of total deflection and Girders 1 and 4 the remaining 43 percent; the overall average difference there was 2.10 millimeters. Across all girders and load cases, the overall average difference settled at 1.82 millimeters, consistent with the scanner’s manufacturer-specified 1-millimeter range and the 2-millimeter threshold the researchers adopted.
Settlement told a subtler story. Because no independent displacement sensor measured support movement, the control values were model-based: reaction forces recorded by U-Line scales at every support were divided by theoretical stiffness values derived from girder geometry and spring stiffness, using Test 0’s all-pin configuration as the datum. Theoretical stiffness came out at 14.24 newtons per millimeter for interior girders and 14.08 newtons per millimeter for exterior girders. Only girders with springs were evaluated, since pin-pin cases produced zero settlement by definition. The largest settlement appeared in Test 10 at Girder 1’s right support under Location A loading, with the control case measuring 41.39 millimeters and the experimental case 35.68 millimeters.
The settlement comparisons held up across loading scenarios. In the unloaded condition, 91 percent of cases showed differences below 5.00 millimeters, a threshold set at the average settlement difference plus one standard deviation; under Location A loading, 84 percent stayed below the threshold, and under Location B, 88 percent did. A persistent asymmetry emerged in which right supports settled more than left supports across all scenarios, which the authors attribute to slight geometric differences or minor imperfections in spring alignment creating localized flexibility on the right side. Three unloaded outliers exceeded the threshold, at Girder 2’s right support in Test 1 and Test 10 and Girder 3’s left support in Test 5.
The full-field data revealed patterns the point sensors could not. Girders with pin-pin supports deflected the most, spring-spring girders the least, and pin-spring girders fell in between, an effect the researchers link to softer supports allowing girder ends to displace rather than rotate. Counterintuitively, spring-spring supports also showed smaller settlements than pin-spring cases, which the team interprets as load-path redistribution: stiffer pin supports attract a larger share of the reaction, reducing the demand borne by the springs. When loading shifted from Location A to Location B, the deformation pattern across the girder system changed in ways that single-point measurements did not consistently reflect, precisely the kind of signature that could flag a bearing or support anomaly for follow-up inspection.
The authors are candid about the limits. Girder 1 consistently showed the largest errors, traced to incidence-angle distortion that made the bottom flange appear concave rather than straight in point clouds at the right support, compounded by partial occlusion from the test frame. Alignment of comparison clouds to the Test 0 datum was performed visually using the laboratory wall and floor as references, so no quantitative registration error metric is available, and settlement results are framed as agreement with expected behavior rather than metrological validation of absolute displacement. The aluminum-and-wood model, static point loading, and idealized boundary conditions do not capture full-scale bridge materials, composite action, dynamic response, or field effects such as temperature, wind, and traffic-induced vibration. Long-term repeatability and drift were not evaluated. The researchers position the method as a rapidly deployable screening tool that flags anomalies for confirmation with direct displacement measurements, and they call for field validation under operational loading, dynamic monitoring with accelerometer comparison, and further automation of segmentation and quality-control checks before LiDAR-based diagnostics enter routine practice.
Subject of Research: LiDAR-based full-field measurement of bridge deflection and support settlement compared with traditional point sensors in a scaled laboratory bridge model
Article Title: Full field LiDAR-based measurement of deflection and support condition effects in a scaled bridge model: comparison with traditional point sensors
Article References: Vrabel, J., Jr., & Trias Blanco, A. (2026). Full field LiDAR-based measurement of deflection and support condition effects in a scaled bridge model: comparison with traditional point sensors. Advances in Bridge Engineering, 7(1), Article 24. https://doi.org/10.1186/s43251-026-00213-8
Image Credits: AI Generated
DOI: 10.1186/s43251-026-00213-8
Keywords: LiDAR, structural health monitoring, bridge deflection, support settlement, terrestrial laser scanning, point clouds, scaled bridge model, load path redistribution, noncontact measurement, string potentiometers, boundary conditions, bridge inspection
Cite Scienmag News
Denise Maddox. (October 30, 2026). LiDAR maps full bridge deflection fields that point sensors miss in scaled model tests. Scienmag. https://scienmag.com/lidar-maps-full-bridge-deflection-fields-that-point-sensors-miss-in-scaled-model-tests/
Denise Maddox. "LiDAR maps full bridge deflection fields that point sensors miss in scaled model tests." Scienmag, 30 October 2026, https://scienmag.com/lidar-maps-full-bridge-deflection-fields-that-point-sensors-miss-in-scaled-model-tests/. Accessed 4 November 2026.
Denise Maddox. "LiDAR maps full bridge deflection fields that point sensors miss in scaled model tests." Scienmag. October 30, 2026. https://scienmag.com/lidar-maps-full-bridge-deflection-fields-that-point-sensors-miss-in-scaled-model-tests/