


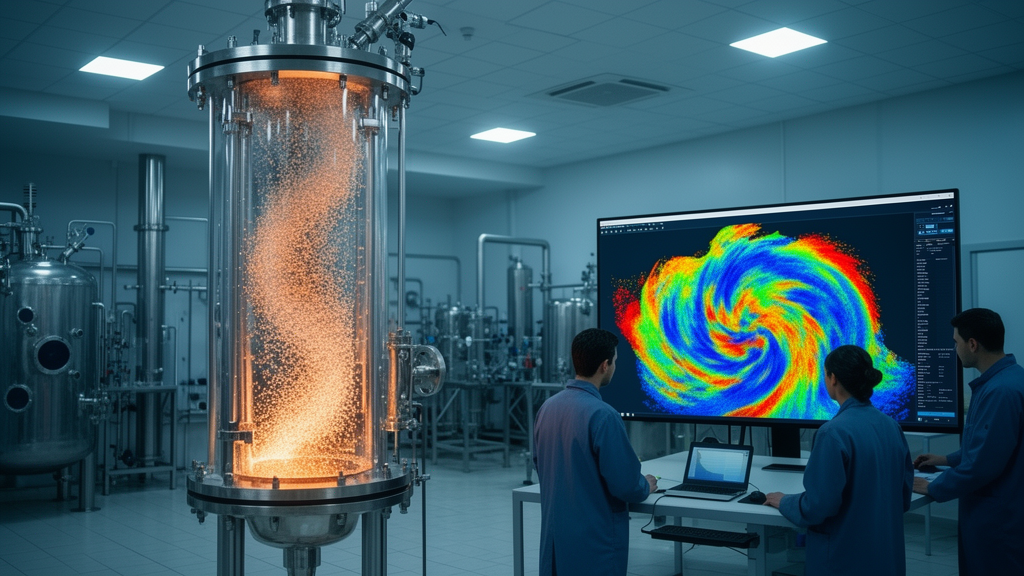
The methanol-to-olefins (MTO) process stands as one of the most consequential catalytic technologies in the modern petrochemical landscape, converting methanol derived from coal, natural gas, or biomass into light olefins—primarily ethylene and propylene—that serve as fundamental building blocks for polymers, plastics, and a vast array of chemical products. At the heart of this process lies a fluidized-bed reactor (FBR), a vessel in which gas flows upward through a bed of catalyst particles at velocities sufficient to suspend and circulate them, creating an intensely dynamic environment where gas–solid contacting, heat transfer, and reaction kinetics are tightly coupled. Predicting the behavior of such reactors has long challenged chemical engineers, because the interplay of multiphase hydrodynamics, turbulence, thermal effects, and catalytic chemistry resists simple mathematical description. Now, a new computational study published in Results in Engineering by Mahdieh Garmsirian, Reza Mosayebbi Behbahani, and Mohammad Reza Khosravi-Nikou of Petroleum University of Technology has delivered one of the most systematic comparisons to date between two competing turbulence-modeling philosophies—Large Eddy Simulation (LES) and Reynolds-Averaged Navier–Stokes (RANS)—applied to a pilot-scale MTO fluidized-bed reactor, and the results carry significant implications for how engineers approach reactor design and scale-up.
The research team employed a computational fluid dynamics (CFD) framework built on the Eulerian multiphase approach, in which both the gas and solid phases are treated as interpenetrating continua. This formulation, often coupled with the kinetic theory of granular flows (KTGF), solves conservation equations for mass, momentum, energy, and species transport, with interphase drag forces modeled using the Gidaspow correlation. The reactor geometry consisted of a pilot-scale riser standing 5 meters tall with a diameter of 0.261 meters, equipped with a perforated distributor at the base. Preheated methanol vapor entered at 673 K with a superficial velocity of 0.75 m/s, contacting SAPO-34 catalyst particles of 60 micrometers in diameter and 1500 kg/m³ in density. The simulations were carried out in ANSYS Fluent using a pressure-based coupled solver with second-order discretization, and a structured hexahedral mesh of approximately 109,000 cells was selected after a rigorous mesh sensitivity analysis demonstrated that this resolution provided an excellent compromise between computational accuracy and cost.
The mesh independence study revealed striking differences in how the solution converged with refinement. A coarse mesh of 89,000 cells deviated by approximately 12.5 percent from the fine-mesh benchmark in time-averaged pressure drop, suffering from higher numerical diffusion that under-predicted transient fluctuations. The medium mesh of 109,000 cells reduced this deviation to just 3.8 percent, while also showing deviations of less than 1.5 percent for time-averaged bed temperature and less than 2.5 percent for ethylene mole fraction at the outlet compared to the fine mesh of 130,000 cells. Solid volume fraction at the reactor outlet varied by less than 2 percent between the medium and fine meshes, further confirming the adequacy of the selected resolution. The researchers also applied the Grid Convergence Index (GCI) methodology proposed by Celik and colleagues to quantify discretization uncertainty, obtaining values of 3.8 percent for pressure drop and 1.5 percent for bed temperature—indications that the numerical solution was not dominated by mesh-related errors for the monitored quantities.
For the reaction chemistry, the team implemented a lumped kinetic model comprising 10 reactions and 20 kinetic parameters derived from laboratory-scale experimental data, based on the reaction network reported by Najafabadi and coworkers. This network captures the sequential conversion of methanol to dimethyl ether, then to light olefins, alongside side reactions producing CO, CO₂, and hydrogen. The kinetic formulation was kept identical across both LES and RANS simulations so that any differences in predicted reactor behavior could be attributed primarily to the turbulence treatment rather than to changes in the reaction model. This methodological choice is critical, as it isolates the effect of turbulence modeling on the coupled hydrodynamic, thermal, and reactive fields—a distinction that many prior studies have failed to make with such clarity.
The results reveal a dramatic divergence between the two turbulence approaches. In the pressure field, LES predicted values ranging from approximately 105 to 520 kPa, capturing the transient and spatially heterogeneous phenomena such as eddies and vortex shedding that characterize real fluidized beds. RANS, by contrast, produced a narrow static pressure range clustered between 190 and 300 kPa, reflecting its inherent time-averaged nature that smooths out instantaneous fluctuations. When compared against the reference operating range of 0.1–0.5 MPa reported for commercial MTO systems, LES achieved deviations of only 4 percent at the inlet and 5 percent at the outlet, with an overall pressure drop of 0.415 MPa deviating by just 3.75 percent from the reference value of 0.4 MPa. RANS, however, under-predicted inlet pressure by 40 percent, over-predicted outlet pressure by 90 percent, and severely underestimated the pressure drop at 0.11 MPa—a staggering 72.5 percent deviation that renders it unreliable for pressure-field prediction in this configuration.
Temperature predictions told a similarly compelling story. LES produced peak temperatures in the range of 733–769 K, exhibiting a gradual and physically realistic distribution with localized hot zones developing smoothly along the reactor riser. RANS generated a sharp localized high-temperature zone reaching 830–856 K concentrated in the middle of the riser, with surrounding areas significantly cooler—a pattern inconsistent with industrial observations. When compared against experimental temperature data from an industrial SMTO reactor reported by Jiang and colleagues, which operates at 705–755 K, LES achieved deviations between 1.98 and 3.97 percent, while RANS deviations ranged from 14.32 to 17.73 percent. The industrial SMTO reactor, with its 8.3-meter internal diameter and 8.884-meter reaction zone height, shows a temperature profile that increases rapidly in the lower section and then stabilizes—behavior consistent with the LES predictions but not with the RANS results.
Velocity fields further underscored the superiority of LES. The LES predictions yielded an average axial velocity of 0.72 m/s, deviating by only 4 percent from the experimental value of 0.75 m/s, while RANS under-predicted at 0.54 m/s—a 28 percent deviation. LES resolved the characteristic S-shaped axial concentration and velocity profiles typical of pilot-scale MTO reactors, capturing the core-annulus structures that define real fluidized-bed behavior. RANS, with its time-averaged formulation, failed to resolve these features, producing lowered velocity magnitudes and reduced mixing. The solid volume fraction distribution revealed equally stark differences: LES predicted a heterogeneous range of 0.30 to 0.55 with pronounced local gradients, dense regions near the walls, and particle clustering consistent with experimental observations, achieving an average deviation of only 5.33 percent from reference simulation data. RANS produced a nearly uniform and smooth distribution ranging from 0.33 to 0.63, with an average deviation of 14.20 percent, lacking the strong heterogeneities and vortex structures that are physically present in real fluidized beds.
Gas volume fraction predictions followed the same pattern, with LES achieving an average deviation of only 3.72 percent from the reference range of 0.43 to 0.72, compared to 10.45 percent for RANS. The propylene mass fraction distribution showed LES reaching a maximum of 0.37 with a broad and dispersed distribution reflecting effective turbulent mixing, deviating by only 5.12 percent from the experimental value of 0.39. RANS predicted a maximum of only 0.33, confined near the reaction zone with limited radial and axial transport, deviating by 15.38 percent. Similarly, ethylene mass fraction predictions showed LES at 0.40 with only a 4.76 percent deviation from the experimental value of 0.42, while RANS under-predicted at 0.37 with a 10.5 percent deviation. These product-distribution results directly demonstrate that the turbulence-model choice propagates through the entire coupled system—from hydrodynamics through heat transfer to reaction performance—affecting the predicted yields of the very products that make the MTO process economically viable.
Methanol conversion and product selectivities provided the most consequential comparison. LES predicted a methanol conversion of 96 percent against an experimental reference of 94 percent, a deviation of only 2.1 percent, while RANS predicted 83 percent—an 11.7 percent under-prediction. Ethylene selectivity from LES reached 46 percent versus the reference 45 percent, while RANS produced only 38 percent, a 15.5 percent deviation. Propylene selectivity showed LES at 36 percent against the reference 35 percent, while RANS yielded 29 percent, deviating by 17.1 percent. Total olefin selectivity—the combined ethylene and propylene yield—reached 82 percent under LES versus the reference 80 percent, while RANS produced only 67 percent, a 16.3 percent deviation. These results confirm that LES provides reaction-performance predictions far closer to available reference values, and that the choice of turbulence model is not merely an academic exercise but has direct consequences for predicted product yields and reactor economics.
The researchers conducted a systematic sensitivity analysis to ensure the robustness of their findings. Variations of ±20 percent in the LES subgrid-scale model parameters produced changes in predicted temperature and velocity fields below 3 percent, indicating relative insensitivity to moderate parameter variations. A ±2 percent variation in inlet velocity and temperature resulted in outlet olefin quantity changes below 2.5 percent, while halving the numerical time step produced changes below 1 percent in temperature and velocity predictions. The reaction model was deliberately kept identical across both turbulence approaches, ensuring that differences between LES and RANS predictions could be attributed primarily to their treatment of the flow field. The authors acknowledge important limitations: the high computational cost of LES, the simplified lumped reaction kinetics that do not resolve elementary surface reactions or hydrocarbon-pool intermediates, the pilot-scale configuration that cannot be directly transferred to industrial scale, and the absence of direct experimental measurements for the exact reactor configuration studied. Nevertheless, the study establishes LES as a powerful computational framework for investigating the complex hydrodynamics of fluidized-bed MTO reactors, providing valuable insights for virtual prototyping, troubleshooting, scale-up studies, and operational optimization—while pointing toward future research directions including hybrid turbulence models, advanced kinetics and catalyst modeling, multi-scale CFD-process integration, and machine-learning-accelerated simulations to bridge the gap between high-fidelity predictions and practical industrial implementation.
Subject of Research: Computational fluid dynamics comparison of LES and RANS turbulence models for methanol-to-olefins fluidized-bed reactor simulation
Article Title: High-fidelity CFD analysis of methanol-to-olefins fluidized-bed reactor: Large Eddy simulation versus RANS turbulence models
Article References: Garmsirian, M., Mosayebbi Behbahani, R., & Khosravi-Nikou, M. R. (2026). High-fidelity CFD analysis of methanol-to-olefins fluidized-bed reactor: Large Eddy simulation versus RANS turbulence models. Results in Engineering, 32, Article 113321. https://doi.org/10.1016/j.rineng.2026.113321
Image Credits: AI Generated
DOI: 10.1016/j.rineng.2026.113321
Keywords: methanol-to-olefins, fluidized-bed reactor, computational fluid dynamics, Large Eddy Simulation, RANS, turbulence modeling, SAPO-34 catalyst, ethylene, propylene, multiphase flow, reactor scale-up, CFD validation
Cite Scienmag News
Denise Maddox. (October 17, 2026). Large Eddy Simulation Outperforms RANS in High-Fidelity CFD Analysis of Methanol-to-Olefins Fluidized-Bed Reactor. Scienmag. https://scienmag.com/large-eddy-simulation-outperforms-rans-in-high-fidelity-cfd-analysis-of-methanol-to-olefins-fluidized-bed-reactor/
Denise Maddox. "Large Eddy Simulation Outperforms RANS in High-Fidelity CFD Analysis of Methanol-to-Olefins Fluidized-Bed Reactor." Scienmag, 17 October 2026, https://scienmag.com/large-eddy-simulation-outperforms-rans-in-high-fidelity-cfd-analysis-of-methanol-to-olefins-fluidized-bed-reactor/. Accessed 17 October 2026.
Denise Maddox. "Large Eddy Simulation Outperforms RANS in High-Fidelity CFD Analysis of Methanol-to-Olefins Fluidized-Bed Reactor." Scienmag. October 17, 2026. https://scienmag.com/large-eddy-simulation-outperforms-rans-in-high-fidelity-cfd-analysis-of-methanol-to-olefins-fluidized-bed-reactor/


