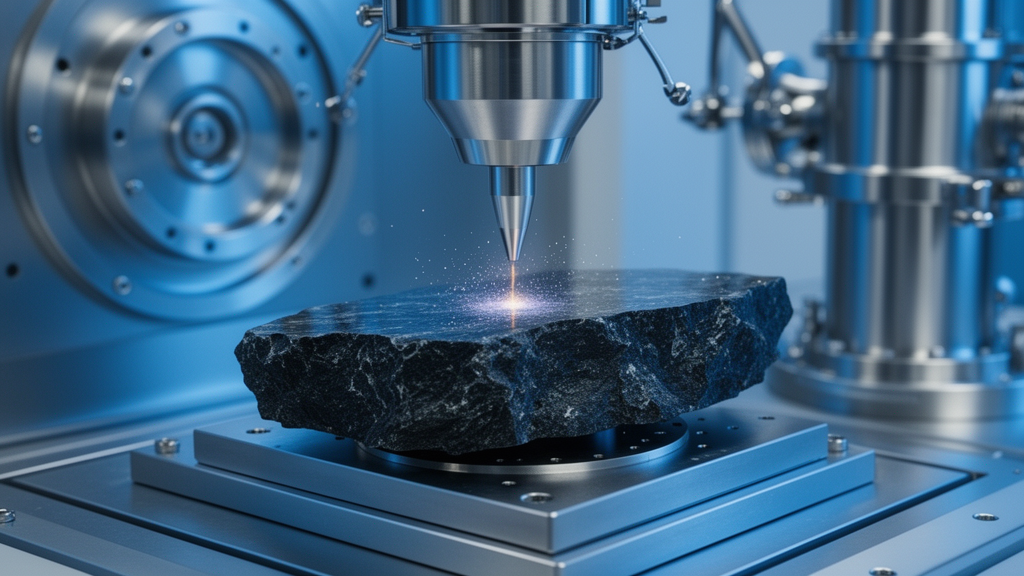
Researchers at the Slovak University of Technology’s Ion Beam Laboratory in Trnava have completed a detailed spectroscopic assessment of pegmatite-spodumene ore from the Kenticha deposit in southern Ethiopia, using time-of-flight elastic recoil detection analysis (ToF-ERDA), particle-induced X-ray emission (PIXE), scanning electron microscopy with energy-dispersive X-ray spectroscopy (SEM-EDS), and X-ray diffraction (XRD). The study, published in Discover Minerals, evaluated the ore’s potential to yield lithium, niobium, and tantalum, three metals central to lithium-ion batteries, fuel cells, electronic components, and nuclear reactor technologies. The work provides quantitative elemental data on a deposit that has previously been characterized only with less sensitive energy-dispersive X-ray fluorescence methods.
The Kenticha pegmatite field lies within the Adola Belt lithotectonic units near Shakisso, Ethiopia, covering an area of roughly 2,500 square kilometers within the Precambrian basement of southern Ethiopia. The rare-element pegmatite there is a significant global source of tantalum, extending about 2,000 meters long and up to 100 meters thick. According to the study, the mine is one of the largest individual producers of tantalum ore in the world, yielding over 120 tons of tantalum concentrate annually, with tantalite containing approximately 55 percent Ta2O5. Samples for the analysis were collected from the Kenticha tantalite plant and represent spodumene-zone lithologies within LCT-complex spodumene-type pegmatites from the lithium-cesium-tantalum-rich upper zone.
The researchers divided the collected material into five subsamples based on color, texture, density, lithology, and magnetic response. Sample KN was the raw pegmatite-spodumene rock; KS1 was a 300-mesh-sized whole-rock powder; KS2 was a 300-mesh spodumene powder; and gravity and magnetic separation of KS2 produced the lighter residue KS3, the non-magnetic fraction KS4, and the magnetic fraction KS5. This separation scheme reflects the conventional beneficiation approach for tantalite ores, in which gravity separation concentrates tantalum- and niobium-bearing minerals together with other heavy minerals, and magnetic separation isolates iron-rich phases such as magnetite from the non-magnetic fraction.
XRD analysis, performed with a PANalytical Empyrean diffractometer using cobalt K-alpha radiation over an angular range of 8.0 to 120.0 degrees two-theta, confirmed the predominance of spodumene in samples KN, KS1, KS2, and KS3, along with lesser amounts of silica oxide, albite, muscovite, magnetite, kaolinite, silicon oxide, iron silicide, and lithium iron oxide. The dominant phases in the beneficiated samples KS4 and KS5 were identified as manganocolumbite, ferrocolumbite, ferrous niobate, and manganese alumina oxide. The strongest diffraction peaks for the spodumene-bearing samples appeared at two-theta values of 32 and 33 degrees, patterns the authors note are consistent with spodumene ores studied at Greenbushes in Australia, the Pilbara region of Western Australia, Koktokay in Xinjiang, China, Haapaluoma in Finland, and eastern Minas Gerais in Brazil.
The ToF-ERDA measurements were carried out with a 45 MeV 197Au8+ analyzing beam at the Ion Beam Laboratory, which operates a 6 MV tandem accelerator equipped for RBS, NRA, PIXE, and ToF-ERDA. The technique simultaneously measures ion mass, recoil ion energy, and time of flight, allowing quantitative depth profiling of all elements from hydrogen to uranium with a sensitivity on the order of 0.02 atomic percent, typically within a 30 to 60 minute measurement. Powdered ore samples were applied in a thin layer to high-purity carbon tape and pressed into it. Because ToF-ERDA is considered an absolute method, no reference calibration samples were required, and most of the ore material, consisting of elements lighter than silicon that PIXE cannot detect, was quantified directly from the ToF-ERDA data.
The ToF-ERDA results showed that samples KN, KS1, KS2, and KS3 contained hydrogen, lithium, beryllium, carbon, nitrogen, oxygen, sodium, aluminum, silicon, potassium, and iron. Sample KS2, the white powdered spodumene concentrate, displayed the highest weight-percent concentrations of lithium, beryllium, carbon, oxygen, fluorine, sodium, silicon, and potassium, with a lithium content of 0.096 weight percent. That figure is markedly higher than the 0.036, 0.066, and 0.047 weight percent measured in samples KN, KS1, and KS3, respectively. The rock sample KN, by contrast, scored a comparatively lower lithium content of 0.036 weight percent but higher iron at 3.337 weight percent, along with elevated rubidium, niobium, and tantalum. Potassium reached its highest composition, 8.053 weight percent, in the raw rock sample KN.
For the beneficiated fractions, ToF-ERDA indicated that the non-magnetic sample KS4 carried elevated weight-percent concentrations of manganese at 0.736, niobium at 28.59, and tantalum at 12.11, together with uranium at 0.163, while the magnetic sample KS5 showed lower values for manganese, niobium, tantalum, lithium, and uranium, but the highest iron content at 27.006 weight percent. On this basis the authors attribute KS4 to manganocolumbite, in which manganese exceeds iron, and KS5 to ferrocolumbite, in which iron dominates. The absence of the ferrous niobate fingerprint near 32 degrees in the KS4 diffraction pattern supported this assignment. The researchers conclude that the non-magnetic KS4 fraction is a basic mineral for the extraction of tantalum and niobium for industrial use in electronics and nuclear applications.
The PIXE analysis, conducted with a 3.5 MeV proton beam at normal incidence and evaluated with the GUPIXWIN program, recorded significant atomic-percent concentrations of chromium, manganese, iron, nickel, zinc, gallium, rubidium, niobium, indium, tantalum, thorium, and uranium among 76 elements detected across the samples. Compared with KN, KS1, and KS3, sample KS2 showed higher weight-percent levels of manganese, nickel, zinc, gallium, indium, and thorium, while exhibiting lower levels of iron, niobium, and tantalum. Rubidium appeared at higher concentrations in the raw samples, whereas niobium and tantalum were most intense in the beneficiated non-magnetic KS4 fraction. The authors also report non-linear behavior in spectra obtained with their silicon drift detector and used the study to critically evaluate the analytical precision achievable with a new GUPIX MAC database.
SEM-EDS spectra indicated higher average atomic-percent concentrations of oxygen, iron, aluminum, and silicon across the samples in the order KS2 greater than KS3 greater than KN greater than KS1, a signature the authors interpret as indicative of aluminosilicates. Aluminum peaked in the white selected spectra with the order KS3 greater than KS2 greater than KS1 greater than KN, while iron was highest in KS1. The presence of potassium, sodium, magnesium, and iron affects the quality of the aluminosilicate ores, and these elements were higher in sample KS2, which was subsequently upgraded by magnetic separation into the tantalum-rich non-magnetic KS4 and the magnetic KS5 fractions. The SEM images showed that most samples have irregular particle shapes in the range of 0.5 to 1.5 millimeters.
The authors present the integrated results as baseline data for designing subsequent hydrometallurgical or pyrometallurgical extraction processes, arguing that the concentrated lithium in the white spodumene powder KS2 and the niobium- and tantalum-rich non-magnetic fraction KS4 underscore the potential for increased extraction and utilization of these metals in lithium-ion batteries, fuel cells, and nuclear reactors. They note that the measured lithium content of KS2 is consistent with spodumene ores from eastern Minas Gerais, Brazil, and that the white color of the highest-lithium material serves as a field identification marker comparable to ores from Australia, China, and Finland. The estimated total uncertainty of the analytical results is in the range of units of percent for major elements and tens of percent for trace amounts, which the authors state is several times smaller than the error introduced by sampling itself.
Subject of Research: Spectroscopic characterization of lithium, niobium, and tantalum in Ethiopian Kenticha pegmatite-spodumene ore
Article Title: ToF-ERDA and PIXE assessments on Kenticha pegmatite-spodumene ore, a basic study for the extraction of Li, Nb, and Ta
Article References: Berhe, G. G., Szaraz, Z., Gogola, P., Tadesse, B., Assayehegn, E., Cheru, M. S., & Noga, P. (2026). ToF-ERDA and PIXE assessments on Kenticha pegmatite-spodumene ore, a basic study for the extraction of Li, Nb, and Ta. Discover Minerals, 3(1), Article 3. https://doi.org/10.1007/s44346-026-00014-x
Image Credits: AI Generated
DOI: 10.1007/s44346-026-00014-x
Keywords: Kenticha, pegmatite, spodumene, lithium, niobium, tantalum, ToF-ERDA, PIXE, XRD, SEM-EDS, Ethiopia, beneficiation
Cite Scienmag News
Violet Maxwell. (October 28, 2026). Ion Beams Map Lithium, Niobium and Tantalum in Ethiopian Kenticha Ore. Scienmag. https://scienmag.com/ion-beams-map-lithium-niobium-and-tantalum-in-ethiopian-kenticha-ore/
Violet Maxwell. "Ion Beams Map Lithium, Niobium and Tantalum in Ethiopian Kenticha Ore." Scienmag, 28 October 2026, https://scienmag.com/ion-beams-map-lithium-niobium-and-tantalum-in-ethiopian-kenticha-ore/. Accessed 28 October 2026.
Violet Maxwell. "Ion Beams Map Lithium, Niobium and Tantalum in Ethiopian Kenticha Ore." Scienmag. October 28, 2026. https://scienmag.com/ion-beams-map-lithium-niobium-and-tantalum-in-ethiopian-kenticha-ore/