


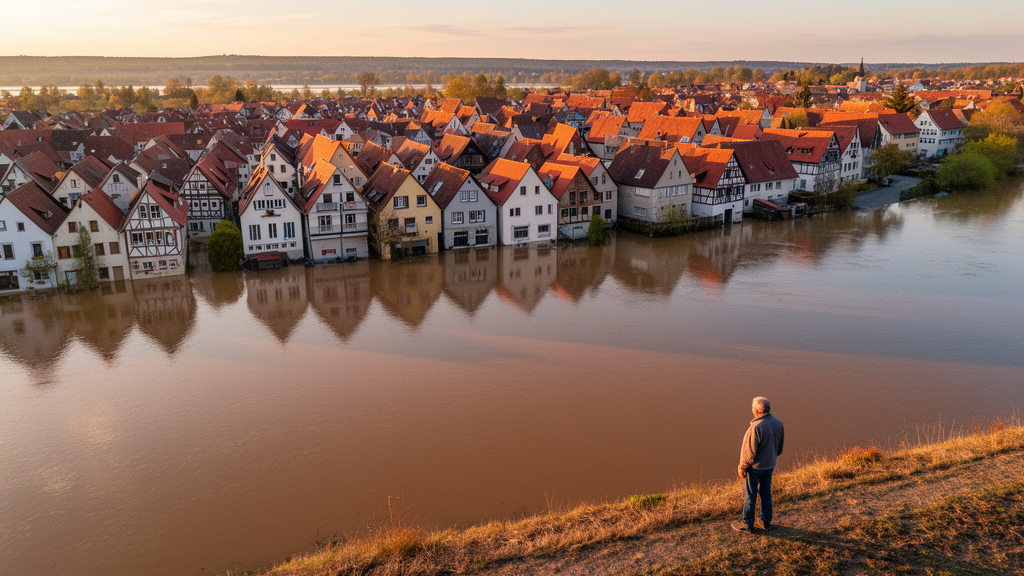
When the floodwaters tore through the Ahr valley in western Germany in July 2021, they destroyed thousands of homes and businesses in a matter of hours. In the aftermath, one deceptively simple question proved surprisingly hard to answer: how much, building by building, was actually at risk? A new study published in Natural Hazards and Earth System Sciences tackles that question head-on, offering the first systematic, building-level evaluation of how well different data sources and methods can estimate the economic value of every structure in a German district. The answer matters far beyond one valley, because the value assigned to exposed assets is one of the most influential, and least scrutinised, numbers in any disaster risk model.
Risk models conceptualise disaster losses as the interaction of three components: hazard, vulnerability, and exposure. Exposure refers to the assets in harm’s way, including buildings, goods, and infrastructure. While hazard and vulnerability modelling have received enormous scientific attention, exposure modelling has often been treated as an afterthought, relying on coarse aggregates spread evenly across communities, blocks, or grid cells. Yet empirical studies consistently identify the monetary value of an asset as a key predictor of flood losses, and previous work has shown that the spatial resolution of asset data can influence modelled losses even more than the method used to estimate them. Flood intensity and building characteristics can vary dramatically from one side of a street to the other, making flood models particularly sensitive to how finely exposure is resolved.
The challenge is that the data needed for building-scale exposure models are fragmented, poorly documented, or locked away. Information on building usage, structural type, and replacement costs is often proprietary, protected by regulation, or scattered across datasets that were never designed to work together. Census statistics, for example, are aggregated to administrative units that align poorly with hazard footprints. To bridge this mismatch, modellers disaggregate regional statistics onto finer spatial units using ancillary data such as land use, population, or nighttime lights. But remarkably few of these disaggregation approaches have ever been validated or directly compared against ground truth, and no published study had previously compared locally explicit building asset values at the object level.
A team led by Aaron Buhrmann of the GFZ Helmholtz Centre for Geosciences and the University of Potsdam, together with colleagues from GFZ, the Karlsruhe Institute of Technology, and the World Bank, set out to close this gap. They focused on the Ahrweiler district, a region with more than 40,000 residential buildings, roughly 6,000 registered companies, and a documented flood history stretching back over 500 years, with more than 70 floods recorded since the first in 1348. The district’s economy is dominated by the service sector, which accounts for 70.9 percent of gross domestic product, followed by manufacturing at 27.8 percent. The researchers systematically searched for freely available building-exposure and asset-value datasets, then designed a set of candidate workflows that combined different building inventories with different value sources.
Four workflows emerged as the main contenders. The first combined the LoD1 dataset, a cadastre-derived federal inventory of building footprints, heights, and functions, with Eurostat national accounts, adapting methods that disaggregate national replacement costs spatially and categorically onto individual buildings. The second paired LoD1 with the Basic European Asset Map, or BEAM, a Copernicus product providing depreciated and net asset values at land-use-polygon scale. The third used the European High-Resolution Exposure model, EHRE, which assigns probabilistic structural classes and replacement costs from the European Seismic Risk Model 2020 to OpenStreetMap building footprints. The fourth, included as a comparison, classified buildings purely by hierarchically prioritised OpenStreetMap and CORINE land-use polygons. Crucially, the team deliberately retained the different cost bases of each source, replacement cost, depreciated cost, and net asset value, for transparency rather than forcing them into a single comparable currency.
To judge these workflows, the researchers built something the field has lacked: a hand-labelled benchmark dataset. They selected four representative study plots and the village of Bad Neuenahr-Ahrweiler, then painstakingly classified 844 sample buildings into 24 use types drawn from the BKI construction cost reference, a German database of several thousand invoiced new-building projects. Classification relied on detailed visual inspection using Google Earth, Street View, Mapillary, and property listings, cross-checked against site visits. Unit construction costs ranged from 160 to 545 euros per cubic metre depending on building type, and each building’s value was calculated by multiplying the relevant unit cost, a regional cost factor of 0.986, and its LoD1-derived volume. This benchmark became the yardstick against which every automated workflow was measured.
The classification results revealed sharp differences. The two LoD1-based workflows performed best, achieving an F1 score of 0.71, and were in near-perfect agreement with each other because both rest on the same cadastral function data. Residential buildings were classified almost flawlessly across all workflows, with recall of at least 0.98. But the cadastral data showed a critical blind spot: it assigns roughly 75 percent of non-residential buildings to a single broad category, building for business or trade, which the workflows mapped to the service sector, while the hand-labelled benchmark identified many of the same buildings as industrial or of ambiguous mixed use. The OpenStreetMap land-use workflow fared worst, with an F1 of 0.45, chiefly because it over-assigned buildings to the residential sector; about 90 percent of benchmark service buildings were misclassified as residential when coarse land-use polygons were downscaled onto individual structures in dense, predominantly residential neighbourhoods.
The asset value comparisons were even more striking. District-wide totals diverged enormously between workflows: the Eurostat-based residential replacement cost estimate came out nearly five times higher than BEAM’s depreciated figure, and the all-sector total of the Eurostat workflow was about 2.1 times larger. Some disaggregated unit rates were implausible, with industrial unit costs running roughly two orders of magnitude beyond comparable published construction costs, because regional sector totals were being spread across cadastral categories that poorly represented the local economy. Echoing earlier Swiss research that found model estimates diverging by factors of 50 to 200 at ten-square-kilometre aggregation, the authors conclude that exposure model asset values contribute a level of uncertainty comparable to other components of the risk model chain, such as vulnerability, where established flood loss models carry mean absolute errors of roughly 15 to 24 percent.
To weigh the less quantifiable factors, the team applied a weighted scoring model, a multiple-criteria decision-making technique in which each workflow is scored from 0 to 10 on criteria including benchmark performance, sustainability, transparency, and adaptability, with weights agreed through iterative consensus among the authors. The LoD1-plus-Eurostat workflow edged out the others, owing mainly to its benchmark performance and its adaptability: Eurostat data are updated annually and cover any year across the Eurozone, whereas BEAM’s update cycles are unclear and EHRE currently has no planned updates. Transparency also mattered. BEAM’s underlying parameters and software pipeline are unpublished and proprietary, while EHRE’s source code is fully open and the Eurostat workflow is described by a single published equation. Notably, EHRE was the only workflow to explicitly represent uncertainty, through probabilistic building types and remainder layers that impute missing OpenStreetMap coverage.
The study’s conclusions carry a clear message for the next generation of disaster risk modelling and impact-based forecasting. Apart from the land-use-based approach, all three asset value workflows can provide a defensible building-level exposure model for Germany, provided they are validated locally, and modellers should choose based on their needs for sustainability, adaptability, and cost basis. The findings are limited to one region with construction practices and economic structures comparable to Ahrweiler, and the authors recommend extending the benchmark dataset, improving the conversion from building height to usable floor area, and exploring machine-learning and remote-sensing methods for asset classification. They also highlight a structural obstacle: building-level economic data are generally treated as privacy-protected under the EU’s General Data Protection Regulation, and the researchers themselves struggled to obtain and release asset-level results. As extreme weather intensifies across Europe, the study makes the case that transparent, maintainable, and locally validated workflows, rather than coarse land-use proxies, are what stand between communities and the blind spots in their risk maps.
Subject of Research: Building-level exposure asset value modelling for disaster risk assessment in Germany
Article Title: Building-level exposure asset value modelling for Germany: an Ahrweiler case study
Article References: Buhrmann, A., Sairam, N., Nievas, C. I., Daniell, J. E., Kreibich, H., & Bryant, S. (2026). Building-level exposure asset value modelling for Germany: an Ahrweiler case study. Natural Hazards and Earth System Sciences, 26(10), 4785-4805. https://doi.org/10.5194/nhess-26-4785-2026
Image Credits: AI Generated
DOI: 10.5194/nhess-26-4785-2026
Keywords: exposure modelling, flood risk, asset value, Ahrweiler, Germany, disaggregation, OpenStreetMap, Eurostat, national accounts, benchmark dataset, impact forecasting, natural hazards
Cite Scienmag News
Violet Maxwell. (October 8, 2026). How Much Is Your House Worth to a Flood? New Study Puts a Price on Every Building in Germany. Scienmag. https://scienmag.com/how-much-is-your-house-worth-to-a-flood-new-study-puts-a-price-on-every-building-in-germany/
Violet Maxwell. "How Much Is Your House Worth to a Flood? New Study Puts a Price on Every Building in Germany." Scienmag, 8 October 2026, https://scienmag.com/how-much-is-your-house-worth-to-a-flood-new-study-puts-a-price-on-every-building-in-germany/. Accessed 8 October 2026.
Violet Maxwell. "How Much Is Your House Worth to a Flood? New Study Puts a Price on Every Building in Germany." Scienmag. October 8, 2026. https://scienmag.com/how-much-is-your-house-worth-to-a-flood-new-study-puts-a-price-on-every-building-in-germany/


