


Every satellite-based measurement of the Earth’s surface rests on a deceptively simple assumption: that the ground beneath a GNSS antenna stays still. In reality, the shallow subsurface beneath thousands of continuously operating GNSS reference stations around the world expands and contracts with temperature, producing vertical motions at the millimetre level that contaminate the very height measurements scientists rely on to track sea-level rise, land subsidence, and crustal deformation. A team of researchers led by Ran Lu and Zhao Li of Wuhan University’s GNSS Research Center, working with colleagues at Queensland University of Technology and the GFZ Helmholtz Centre for Geosciences, has now released a global dataset of temperature-driven thermoelastic displacement (TED) covering approximately 14,000 GNSS stations from 2000 to 2023, published in Earth System Science Data.
The physical mechanism behind TED is rooted in classical thermoelasticity. As temperature variations at the surface diffuse downward through heat conduction, they produce depth-dependent thermal strain in soil and bedrock beneath GNSS stations. This strain is transferred elastically to the ground surface and appears directly in GNSS height time series. The concept traces back to foundational work by Biot in 1956 and Berger in 1975, but its global-scale consequences for satellite geodesy have only recently become fully appreciated. Previous studies have shown that shallow subsurface thermoelastic effects contribute to seasonal height variations at some GNSS sites, and millimetre-level nonseasonal thermoelastic displacements have been detected by high-precision geodetic observations in some regions.
What makes the new dataset distinctive is its treatment of the shallow subsurface as a layered medium rather than a homogeneous one. Earlier analytical models relied on idealized elastic half-space or uniform elastic-sphere formulations with effectively depth-invariant thermophysical and elastic properties. While computationally efficient, these approaches cannot represent the attenuation and phase lag of thermal signals caused by soil-bedrock stratification, nor account for station-to-station differences in shallow subsurface conditions. The team instead implemented a full-spectrum layered finite-element model (FEM_FL) that solves the transient heat-conduction problem and computes surface displacement induced by the resulting temperature-dependent strain within a consistent numerical framework for each station independently.
The model is driven by hourly ERA5 soil-temperature forcing from the ECMWF reanalysis, using the shallowest 0–7 cm soil-temperature layer to prescribe the near-surface upper thermal boundary. Depth-dependent subsurface properties are parameterized using SoilGrids 2.0, which provides global land soil-property maps at 250 m spatial resolution across six standard depth intervals from 0 to 200 cm. Below 2 m, the model represents the medium as a homogeneous bedrock background with prescribed thermal and elastic properties. This choice reflects the depth range of available global soil data rather than an assumption that thermoelastic effects vanish at that depth, and the SoilGrids-based layering captures the main shallow subsurface contrasts relevant to the annual thermal cycle.
A key technical challenge involves temporal sampling. GNSS coordinate time series are typically provided at daily resolution, whereas near-surface temperature and the resulting thermoelastic response depend strongly on local solar time. If temperature forcing is sampled at only one fixed epoch, stations at different longitudes correspond to different local times, and part of the diurnal temperature signal may alias into longer-period components. To reduce this effect, the team sampled the hourly ERA5 record at four equally spaced epochs per day (00:00, 06:00, 12:00, and 18:00 UTC), producing four TED realizations for each station. Each realization was decomposed into annual, semiannual, and residual components, with harmonic components averaged using amplitude-phase vectors to preserve the mean magnitude and timing of the seasonal signal.
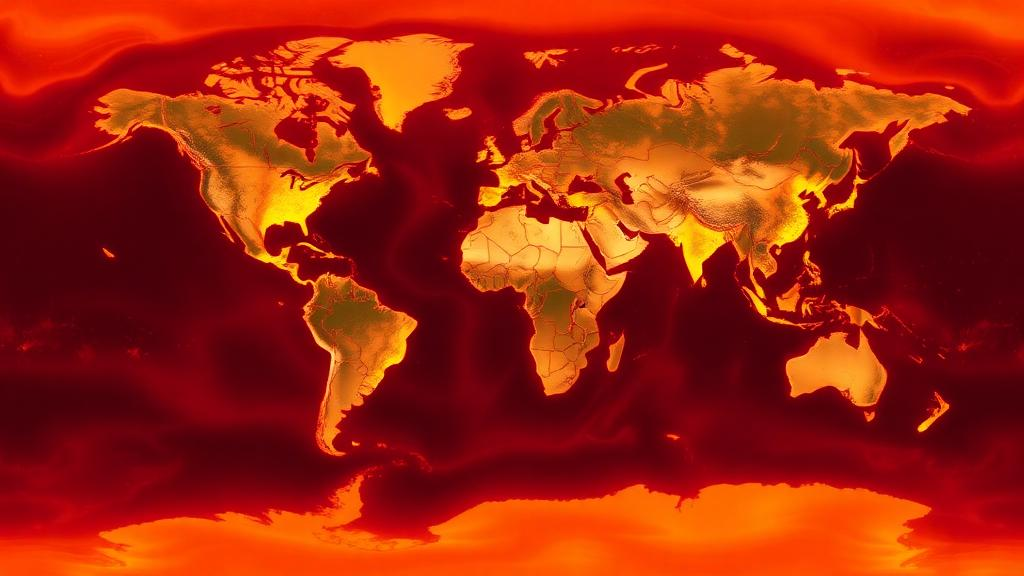
The resulting dataset reveals clear spatial patterns in thermoelastic displacement. Annual TED amplitudes are mostly within about 0.2–1.2 mm, with locally larger values exceeding 1.5 mm in regions with strong seasonal temperature contrasts. Relatively large signals are concentrated in mid-latitude continental areas, including parts of North America, Europe, East Asia, and Australia, whereas humid maritime regions and low-latitude areas generally show weaker annual responses. The annual phase shows a clear hemispheric contrast, consistent with the opposite seasonal heating cycles in the Northern and Southern Hemispheres. The percentile-based peak-to-peak variability of the full daily TED series commonly reaches 2–4 mm in continental regions and locally approaches 5–6 mm, while nonseasonal variability after removing the linear term and annual and semiannual harmonics is mostly below 1 mm but can locally reach millimetre level.
Technical evaluation of the dataset focused on three aspects: the influence of the SoilGrids-based subsurface parameterization, sensitivity to key thermal and elastic parameters, and spectral behaviour of the modelled time series. For the 2,612 stations with documented foundation-depth information, site-information-constrained solutions agree closely with SoilGrids-based solutions, with annual-amplitude differences mostly about 0.01–0.03 mm and annual-phase differences generally within 1–3 degrees. Sensitivity tests using ±10 percent perturbations in the linear thermal expansion coefficient, thermal diffusivity, and Young’s modulus indicate that the amplitude and phase of the annual TED component are stable under reasonable parameter uncertainty, with the largest sensitivity occurring mainly in dry inland regions where stronger seasonal temperature forcing also produces larger TED signals.
Spectral analysis of the TED series shows a dominant annual peak at 1 cycle per year and a weaker semiannual peak near 2 cycles per year in all latitude bands, consistent with the temperature-driven origin of the modelled displacement. Spectral power is also present at higher frequencies, indicating that the released series retain nonseasonal variability rather than representing only fitted annual and semiannual terms. The annual peak is stronger in mid- and high-latitude bands than in low-latitude bands, reflecting the stronger seasonal temperature cycle outside the tropics. Regional spectra show similar features, with North America, Europe, and East Asia generally showing stronger annual and semiannual peaks, whereas Australia and some lower-latitude or maritime regions show weaker seasonal power.
When applied alone to GNSS height time series, the TED correction produces positive weighted root-mean-square (WRMS) reductions at about 79 percent of the assessed stations, with most improvements within 3–5 percent and the largest reductions reaching about 10 percent. Some stations show negative WRMS reductions, locally around −2 to −5 percent, indicating that the TED-only correction does not improve every GNSS height series. This behaviour is expected because TED is only one part of the non-tectonic vertical displacement observed by GNSS, and its amplitude is usually smaller than hydrological loading and many local site-dependent signals. Even so, the spatial pattern suggests that TED explains part of the GNSS height variability, especially in continental regions with stronger seasonal temperature forcing.
The released product represents subsurface thermoelastic deformation only and does not include thermal expansion of above-ground structures such as concrete pillars, steel masts, rooftop monuments, or antenna-support structures. These monument-related effects can be important at individual stations and are not included because globally complete information on monument height, material, geometry, anchoring condition, and local thermal environment is not available for most GNSS stations. The TED series should therefore be interpreted as a subsurface thermoelastic correction rather than a complete correction for all temperature-related site effects. The dataset is publicly available on Zenodo and through the Ground Motion Data Service platform, with files organized by station and including date tags, vertical TED displacements in millimetres, station coordinates, record start and end dates, and dataset version information. Future updates may address snow, soil moisture, and frozen ground processes, and may consider sub-daily products after further validation with appropriate GNSS solutions.
Subject of Research: Temperature-driven thermoelastic displacement of the shallow subsurface and its effect on GNSS station height measurements
Article Title: TED: a global temperature-driven thermoelastic displacement dataset for GNSS reference stations (2000–2023)
Article References: Lu, R., Li, Z., Ye, L., Yuan, P., & Feng, Y. (2026). TED: a global temperature-driven thermoelastic displacement dataset for GNSS reference stations (2000–2023). Earth System Science Data, 18(10), 7575-7591. https://doi.org/10.5194/essd-18-7575-2026
Image Credits: AI Generated
DOI: 10.5194/essd-18-7575-2026
Keywords: GNSS, thermoelastic displacement, TED dataset, ERA5, SoilGrids, finite-element model, vertical land motion, reference frame, geodesy, soil temperature, height time series, crustal deformation
Cite Scienmag News
Violet Maxwell. (October 19, 2026). Global dataset maps how heat makes the ground beneath GPS stations breathe. Scienmag. https://scienmag.com/global-dataset-maps-how-heat-makes-the-ground-beneath-gps-stations-breathe/
Violet Maxwell. "Global dataset maps how heat makes the ground beneath GPS stations breathe." Scienmag, 19 October 2026, https://scienmag.com/global-dataset-maps-how-heat-makes-the-ground-beneath-gps-stations-breathe/. Accessed 19 October 2026.
Violet Maxwell. "Global dataset maps how heat makes the ground beneath GPS stations breathe." Scienmag. October 19, 2026. https://scienmag.com/global-dataset-maps-how-heat-makes-the-ground-beneath-gps-stations-breathe/


