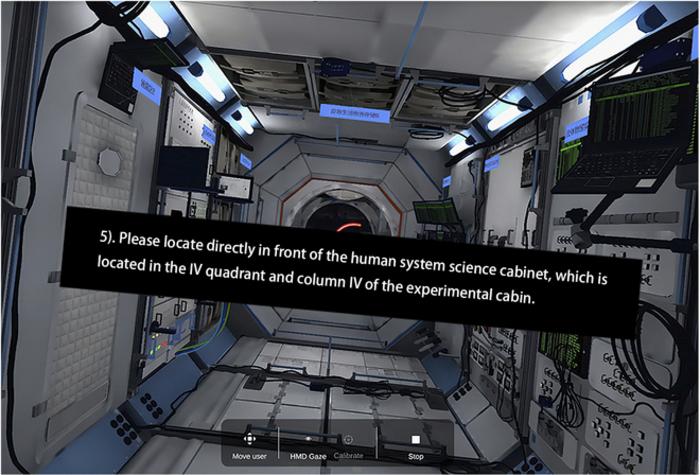
Firstly, the authors provided a detailed explanation of the experimental methods and procedures. This study recruited 30 healthy subjects (15 males and 15 females), aged between 20 to 50 years, with an average age of 42 ± 6.58 years. All participants had no severe visual or auditory impairments and were right-handed. The subjects met the biometric standards for astronaut candidates and were rigorously screened. The experiment used Unity 3D to model the space station, simulating the internal scenes of the space station. The subjects started from the core node module and found the laboratory module I, where they operated the Space Raman Spectrometer (SRS), performing steps including retrieval, adjustment, installation, assembly, calibration, and testing. The subjects used the Vive Pro Eye professional VR headset with built-in headphones and Tobii Pro VR Analytics software for data analysis. Visual instructions were displayed on a black background with white bold font (32 dmm). The schematic diagram of the visual instructions in the space station simulation model is shown in Fig. 1. Auditory instructions were played at a volume of 60 decibels, with intonation conforming to normal conversation habits.”

Credit: Space: Science & Technology
Firstly, the authors provided a detailed explanation of the experimental methods and procedures. This study recruited 30 healthy subjects (15 males and 15 females), aged between 20 to 50 years, with an average age of 42 ± 6.58 years. All participants had no severe visual or auditory impairments and were right-handed. The subjects met the biometric standards for astronaut candidates and were rigorously screened. The experiment used Unity 3D to model the space station, simulating the internal scenes of the space station. The subjects started from the core node module and found the laboratory module I, where they operated the Space Raman Spectrometer (SRS), performing steps including retrieval, adjustment, installation, assembly, calibration, and testing. The subjects used the Vive Pro Eye professional VR headset with built-in headphones and Tobii Pro VR Analytics software for data analysis. Visual instructions were displayed on a black background with white bold font (32 dmm). The schematic diagram of the visual instructions in the space station simulation model is shown in Fig. 1. Auditory instructions were played at a volume of 60 decibels, with intonation conforming to normal conversation habits.”
This experiment used a 2 × 2 Latin square design. Thirty subjects were randomly divided into AB and BA sequence groups and received training on VR device operation before the experiment. Completion time, operation error rate, and eye movement data were recorded, and the NASA-TLX scale was used post-experiment to assess mental workload. The Shapiro-Wilk method was used to test the normality of the data. For normally distributed data, paired t-tests were used; for non-normally distributed data, Wilcoxon paired signed-rank tests were used. Data were presented as mean ± standard deviation (x ± SD), with a significance level of P < 0.05 and a highly significant level of P < 0.01.Additionally, to analyze eye movement data, researchers defined the control panel and markers in the space station model as Areas of Interest (AOIs). In this experiment, AOIs were defined as the areas marked with blue boxes on the screen (Fig. 2 shows the AOI of the SRS). Tobii Pro VR Analytics software was used to analyze the frequency and duration of views in these areas. To gain deeper insights into the participants' subjective experiences with AR visual and auditory guidance, unstructured interviews were conducted with the 30 subjects after the experiment to gather their subjective feelings and suggestions for improvement regarding AR visual and auditory guidance.
Then, the authors filtered and processed the outlier data, excluding cases with abnormal data from 13 male and 12 female subjects. They used the NASA-TLX scale to subjectively score the participants’ mental workload. In terms of psychological demand, time demand, frustration, and total score, AR visual guidance was significantly lower than auditory guidance. In terms of task completion time and task operation error frequency, AR visual guidance also showed advantages. As shown in Fig. 3, eye movement data analysis revealed that in aspects such as fixation points, scan distance, total fixation duration, and average pupil diameter, the AR visual guidance group performed significantly better than the auditory guidance group.
Finally, the authors concluded the study. This research compared the effects of AR visual and auditory instructions on space station astronauts completing procedural tasks, using a Latin square experimental design. The results showed that AR visual instructions were superior to auditory instructions in terms of task completion time, number of operation errors, and eye movement data, supporting the view that AR instruction modes have advantages in task performance and cognitive load. However, there were no significant differences between AR visual and auditory guidance in the “physical demand” and “self-performance” aspects of the NASA-TLX scale, as well as in regression time. This may be because the tasks did not involve high-intensity physical activity or aspects requiring special attention to self-performance. This study fills a gap in previous research, and the results provide new evidence for the design of human-computer interaction instruction modes, helping to reduce astronauts’ cognitive load and impr
Journal
Space: Science & Technology
Article Title
Effects of Visual and Auditory Instructions on Space Station Procedural Tasks
Article Publication Date
9-May-2024