


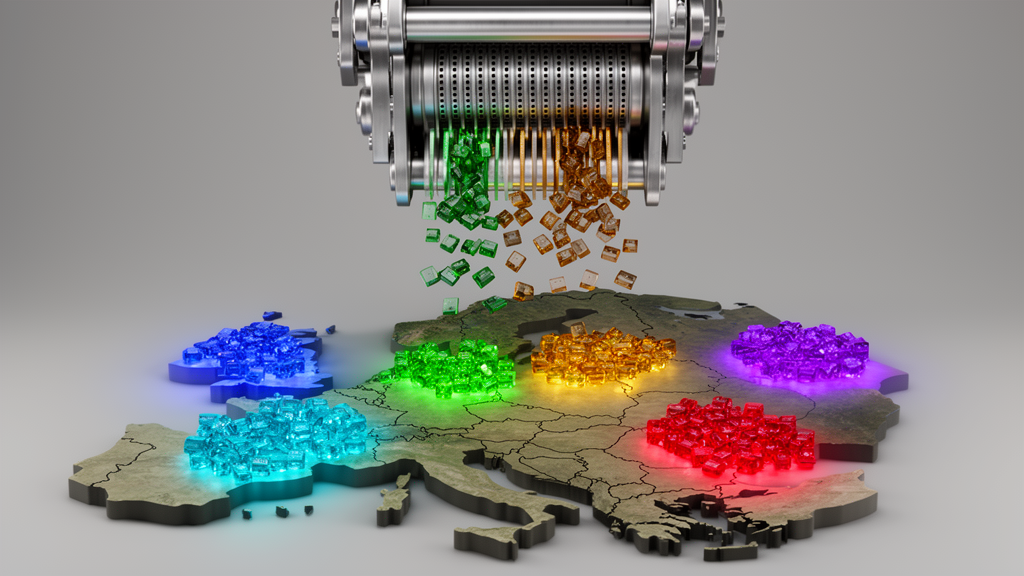
A new clustering analysis of the 27 European Union Member States has placed corporate taxation alongside economic, environmental, and energy indicators to build a multidimensional map of sustainability profiles across the bloc. The study, published in Discover Sustainability, covers the period from 2013 to 2023 and uses a balanced panel of 297 country-year observations. Rather than treating tax policy as a driver of sustainability outcomes, the researchers treated the effective average corporate tax rate as a fiscal-context variable within a multivariate classification, asking how it contributes to differentiating groups of countries whose economies, emissions, and energy systems otherwise fit together in characteristic ways.
The baseline feature space combined five dimensions: real GDP per capita, greenhouse gas emissions, primary solid biofuel use, primary energy consumption, and the effective average corporate tax rate. All variables were standardized before clustering. The team applied two complementary algorithms, Ward hierarchical clustering and k-means, and evaluated alternative solutions ranging from two to six clusters using several internal validation criteria: within-cluster sum of squares, the silhouette coefficient, the Calinski-Harabasz index, the Davies-Bouldin index, cluster-size diagnostics, and the degree of correspondence between the Ward and k-means solutions.
The selected six-cluster solution recorded a silhouette coefficient of 0.485765, a moderate value indicating reasonably coherent groupings in data of this kind. The authors did not rely on a single fit statistic; the solution was further assessed through repeated initialization, subsampling, annual membership trajectories, and two robustness specifications.
The analysis revealed substantial heterogeneity in the joint economic, environmental, energy, and fiscal configurations of EU Member States. No single archetype captures the bloc: countries differ simultaneously in income levels, emissions, biofuel reliance, energy consumption, and corporate tax settings, and these dimensions combine into distinguishable profiles rather than varying independently.
Temporal tracking added a second layer of insight. Twenty-two countries retained unchanged cluster membership throughout the entire 2013 to 2023 study period, meaning their relative positions in the multidimensional space were stable year after year. The remaining five countries accounted for seven year-to-year transitions between clusters, marking them as the bloc’s movers in sustainability terms over the decade examined.
Corporate taxation, the study found, contributes to differentiation among the identified profiles but does not display a uniform association with environmental or energy conditions. In other words, the fiscal-context variable helps separate country groups, yet the data do not show a single consistent pattern linking corporate tax levels to emissions, biofuel use, or energy consumption across the union. This positioning is deliberate: the authors frame taxation as part of the fiscal context within which sustainability transitions unfold, not as a standalone explanatory factor.
Two robustness checks probed how sensitive the classification is to its inputs. Excluding Germany left the membership structure of the remaining observations almost unchanged, with an adjusted Rand index of 0.995, indicating that the overall partition does not depend on any single large economy. By contrast, replacing the aggregate environmental and energy variables with per-capita, proportional, and intensity-based measures produced a materially different partition, with an adjusted Rand index of 0.513. This contrast shows that the choice of how environmental and energy pressures are measured, in absolute totals or scaled to population and economic activity, substantially shapes which countries appear similar.
The study’s contribution lies in integrating fiscal context, temporal membership, stability assessment, and specification sensitivity within a unified analytical framework for sustainability clustering. The authors position the resulting classification as a structured basis for comparative benchmarking and for context-sensitive assessment of heterogeneous sustainability transitions across the European Union, rather than as a ranking of countries or a test of causal effects.
Subject of Research: Multivariate clustering of economic, environmental, energy, and corporate tax indicators across the 27 EU Member States from 2013 to 2023
Article Title: Corporate taxation within multidimensional sustainability profiles of European Union Member States
Article References: Barbuta-Misu, N., Georgescu, P. L., Zlati, M. L., Fortea, C., & Antohi, V.-M. (2026). Corporate taxation within multidimensional sustainability profiles of European Union Member States. Discover Sustainability. https://doi.org/10.1007/s43621-026-05145-x
Image Credits: AI Generated
DOI: 10.1007/s43621-026-05145-x
Keywords: corporate taxation, European Union, sustainability profiles, cluster analysis, k-means, Ward hierarchical clustering, greenhouse gas emissions, energy consumption, GDP per capita, Discover Sustainability, multivariate classification, country-year panel
Cite Scienmag News
Sloane Callahan. (October 26, 2026). Corporate Taxation Helps Sort EU Countries into Six Distinct Sustainability Profiles. Scienmag. https://scienmag.com/corporate-taxation-helps-sort-eu-countries-into-six-distinct-sustainability-profiles/
Sloane Callahan. "Corporate Taxation Helps Sort EU Countries into Six Distinct Sustainability Profiles." Scienmag, 26 October 2026, https://scienmag.com/corporate-taxation-helps-sort-eu-countries-into-six-distinct-sustainability-profiles/. Accessed 26 October 2026.
Sloane Callahan. "Corporate Taxation Helps Sort EU Countries into Six Distinct Sustainability Profiles." Scienmag. October 26, 2026. https://scienmag.com/corporate-taxation-helps-sort-eu-countries-into-six-distinct-sustainability-profiles/


