

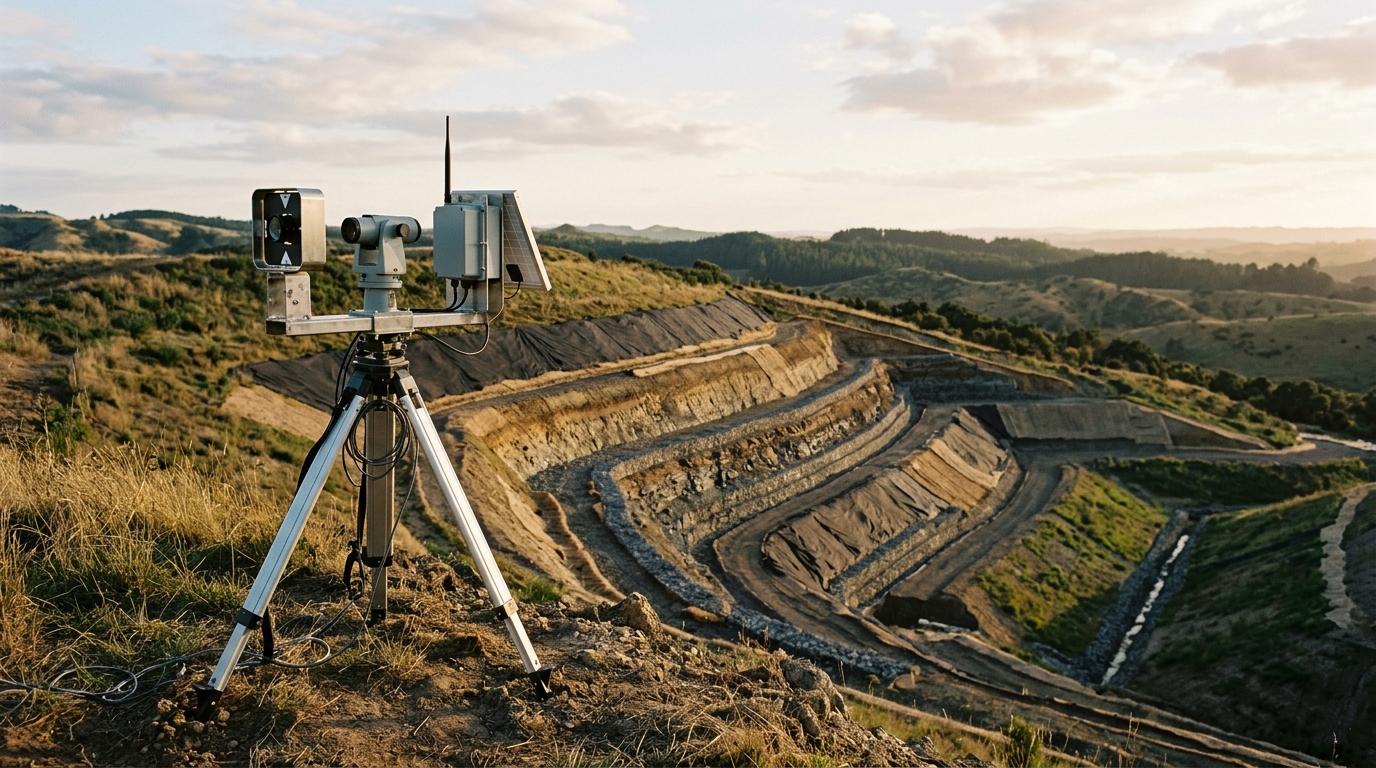
Slope failures remain among the most damaging geohazards in hilly terrain, and a new study now offers a faster way to quantify how likely they are. Researchers Shubham Mani Tripathi, Suvam Das and Anindya Pain have built a probabilistic slope stability framework that pairs a Box–Behnken Design (BBD) with a response surface method, replacing hundreds of repeated numerical simulations with a single fitted equation. The work, published as open access research on 14 July 2026, treats six uncertain inputs as random variables: soil cohesion, internal friction angle, surcharge load, nail spacing, nail length and the pseudo-static coefficient that stands in for earthquake shaking. The result is a computationally light route to a probability of failure, a quantity that deterministic analysis cannot deliver on its own.
The motivation is straightforward. Slope stability is conventionally judged by the Factor of Safety, or FOS, defined as the ratio of resisting forces to driving forces within a slope system. A value of one or below signals a slope at or past the verge of failure, while higher values indicate stability. Resisting forces come from the index properties of the slope-forming materials, whereas driving forces include surcharge loads and earthquake-induced dynamic loads that erode the effectiveness of resistance. Deterministic analysis assigns fixed values to every material property and load, but those properties are often uncertain, and a single deterministic result may lead to conservative approximations. Probabilistic methods address these uncertainties more reliably, and the response surface method is a common tool within them, acting as a surrogate for the original numerical system.
What distinguishes this study is the choice of experimental design behind the surrogate. The Box–Behnken approach, proposed by Box and Behnken, uses three levels for each input factor and places design points at the centres of the edges of the process space and at the centre, deliberately avoiding runs at the extreme combinations of all factor levels. That avoids unrealistic or unsafe conditions that could produce unrepresentative outcomes, a risk the authors note for the Central Composite Design. Compared with a three-level full factorial design, which grows exponentially as factors multiply, BBD needs far fewer runs, saving time, cost and resources. Its experimental economy is comparable to the Doehlert matrix, and both designs show higher efficiency and robustness than the Central Composite Design in the comparative evaluation the authors cite. The design is also rotatable, giving uniform prediction precision in all directions from the centre point, and it can tolerate a botched run or two without collapsing the model’s reliability.
The numerical engine underneath is the Finite Difference Method, run in the open-source FLAC/Slope software with a Mohr–Coulomb constitutive model. Unlike the Finite Element Method, which discretises the domain into a mesh of finite elements, FDM divides the slope into a structured grid of points and solves the governing geomechanics equations by finite difference approximations, iterating from initial value guesses through boundary condition application to updates at each grid point. The Shear Strength Reduction method is typically used in such continuum analyses to identify the critical FOS. Applying the BBD scheme, the researchers generated 54 design points, including six central points, for the six random variables and analysed each with FDM to obtain the corresponding FOS values. Those results fed an ANOVA-based second-order polynomial equation that estimates FOS for any new combination of inputs, capturing linear, quadratic and interaction terms in one expression.
The slope itself was adopted from a reference study by Imani Kalehsar and colleagues, who had used FLAC3D for a three-dimensional nailed-slope analysis. The geometry was fixed at 28 metres in length, 12 metres in height and 3 metres in width, with a 45-degree angle and a 16-metre edge length, comprising 8064 hexahedral zones. The soil used a density of 1900 kilograms per cubic metre, a Young’s modulus of 15 megapascals, a Poisson’s ratio of 0.42, an internal friction angle of 30 degrees and a cohesion of 5 kilopascals. Six rows of nails, each 6 metres long and inclined at 15 degrees to the horizon, were spaced 1 metre horizontally and vertically. To validate the model, the team compared their results against the reference values for different loading conditions and found all deviations below 10 percent. Mesh testing showed that high and medium grid options produced identical FOS values, so medium meshing was selected to save computational time.
The seismic side of the analysis rests on the pseudo-static approach, a technique used since the 1920s in which earthquake effects are simplified into constant horizontal and, sometimes, vertical acceleration forces applied through the centroid of the failure mass. Terzaghi provided the first explicit, well-documented application of the method to seismic slope stability, and he suggested horizontal coefficients of 0.1, 0.2 and 0.3 for severe, destructive and catastrophic earthquake scenarios respectively. Because real slope materials are deformable and peak ground acceleration lasts only a brief moment, practical pseudo-static coefficients are generally chosen lower than the peak acceleration. This study considered only the horizontal component, ranging from 0.1 g to 0.3 g, since pseudo-static results depend primarily on the horizontal seismic force.
Validation of the fitted equation came from a self-check with 50 randomly generated parameter combinations, whose FOS values were computed both by FDM and by the polynomial. The agreement was strong, with a coefficient of determination of 0.998 in both the 54-run fit and the 50-set validation, comfortably above the 0.9 threshold the authors set. The regression model itself showed a model f-value of 206.07 with a p-value below 0.0001, predicted and adjusted r-squared values of 0.975 and 0.990 that differ by less than 0.2, an adequate signal-to-noise ratio of 56.419, and a coefficient of variation of 3.77 percent, indicating a reasonably reproducible model.
Running the equation over 50,000 samples drawn from normal probability distributions for all six inputs produced a probability of failure of 0.80, a relatively high susceptibility under the considered conditions. The authors attribute this largely to the pseudo-static force, which increased the destabilising forces and reduced the computed FOS; the reference study’s FOS values generally lay below 1.5, meaning the slope was already close to critical even before seismic loading. Sensitivity analysis via a perturbation plot identified cohesion as the most influential factor, followed by the internal friction angle and the pseudo-static coefficient, which showed roughly equal but opposite deviations. Surcharge load and nail spacing had smaller, roughly equal effects, both inversely related to FOS, while nail length showed the least deviation, plausibly because longer nails below the failure depth add little resistance. Interaction surfaces showed that even at the highest cohesion of 10 kilopascals, a pseudo-static coefficient of 0.3 left the slope at the verge of failure with an FOS near 1.0.
The framework’s limits are stated plainly. The pseudo-static method assumes a constant, unidirectional acceleration, ignoring the duration, frequency content and cyclic loading patterns of real earthquakes, and Terzaghi’s own observation that a slope may fail even with a computed pseudo-static FOS above 1 underscores that it does not reliably represent actual seismic behaviour. The model is valid only within the parameter ranges studied, random variables were evaluated under dry conditions, and soil properties were assigned single values across the whole slope domain rather than varying with depth. Groundwater, nail inclination and random-field approaches are flagged as future extensions. Even so, the authors present the BBD-based response surface as a reliable, less time-consuming alternative to repeated numerical simulation, and they encourage practitioners to consider it for real field applications where probabilistic assessment has previously been too costly to attempt.
Subject of Research: A probabilistic slope stability assessment framework combining Box–Behnken Design response surface modelling with finite difference analysis of a nailed soil slope under pseudo-static seismic loading.
Article Title: Probabilistic slope stability assessment framework using Box–Behnken Design based response surface method
Article References: Tripathi, S. M., Das, S., & Pain, A. (2026). Probabilistic slope stability assessment framework using Box–Behnken Design based response surface method. Discover Hazards, 2(1), Article 49. https://doi.org/10.1007/s44475-026-00055-y
Image Credits: AI Generated
DOI: 10.1007/s44475-026-00055-y
Keywords: slope stability, Box–Behnken Design, response surface method, probability of failure, finite difference method, pseudo-static analysis, soil nailing, geohazard risk, Monte Carlo sampling, seismic loading, uncertainty analysis, Probabilistic
Cite Scienmag News
Violet Maxwell. (November 4, 2026). Box–Behnken Design Speeds Probabilistic Slope Stability Analysis. Scienmag. https://scienmag.com/box-behnken-design-speeds-probabilistic-slope-stability-analysis/
Violet Maxwell. "Box–Behnken Design Speeds Probabilistic Slope Stability Analysis." Scienmag, 4 November 2026, https://scienmag.com/box-behnken-design-speeds-probabilistic-slope-stability-analysis/. Accessed 6 November 2026.
Violet Maxwell. "Box–Behnken Design Speeds Probabilistic Slope Stability Analysis." Scienmag. November 4, 2026. https://scienmag.com/box-behnken-design-speeds-probabilistic-slope-stability-analysis/