


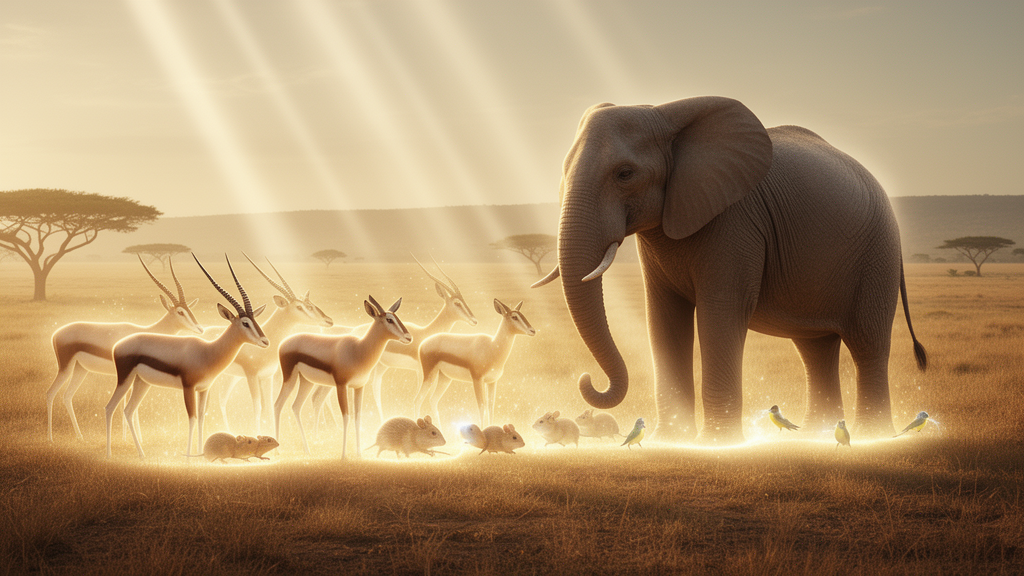
Every ecosystem on Earth faces the same quiet arithmetic: the energy flowing through it must be divided among the organisms living there, and body size decides who gets the biggest slice. A new global analysis of more than 12,000 bird and mammal species has now mapped that division across the entire planet, and the results overturn a decades-old assumption about how nature spends its energy budget. The study, published in Frontiers of Biogeography, reveals that energy is distributed unevenly across body size classes — and that larger animals, long assumed to be energetically disadvantaged, actually capture more energy on average than smaller ones, especially in the world’s most productive ecosystems.
The research tackles one of the most fundamental relationships in ecology: the link between a species’ body mass and the number of individuals it supports. Because every organism must eat to maintain its biomass, larger species are generally expected to be rarer than smaller ones. Ecologists have long used a benchmark derived from Kleiber’s Law — the observation that basal metabolic rate scales with body mass raised to the 0.75 power — to propose that a slope of -0.75 between log-transformed body mass and abundance should indicate energetic equivalence among species. Under that null hypothesis, each species, regardless of size, would command roughly the same share of ecosystem energy. Deviations from the benchmark would signal competitive advantages for either larger or smaller organisms.
Testing that idea at a global scale has been surprisingly difficult. Earlier macroecological analyses pooled average body masses and abundances of species from sites around the world into a single regression, but that approach mixes species that never coexist and cannot reflect how energy is actually partitioned within real communities. Sparse abundance data — collected unevenly across continents and taxonomic groups — has made comprehensive local assessments unfeasible. The new study sidesteps this limitation by building spatially explicit models that predict the abundance of every described terrestrial bird and mammal species across its entire geographic range, at a resolution of one-degree grid cells.
The modelling framework rests on TetraDENSITY 2.0, a global database of empirical abundance estimates for tetrapods containing 51,605 data points for birds and mammals. After standardisation and taxonomic harmonisation, the final training dataset included 9,319 abundance estimates covering 890 mammal species and 5,118 estimates covering 1,751 bird species. The researchers fitted separate generalised additive mixed models for each taxon, using predictors identified in the literature as key drivers of abundance: for mammals, adult body mass, dietary percentages, locomotion strategy, net primary productivity and precipitation seasonality; for birds, body mass, trophic status, territorial behaviour, nesting and mating strategies, migratory status, productivity and several climatic variables. Both models accounted for phylogenetic non-independence among species and spatial autocorrelation across sites.
Validation was deliberately stringent. The models were trained and tested using spatial block cross-validation, in which data from 80 percent of 10-by-10-degree blocks trained the model and the remaining 20 percent tested it, ensuring that abundance estimates used for testing showed negligible spatial autocorrelation with training data. A parallel taxonomic block cross-validation tested the models’ ability to predict abundances of entirely unknown genera. Mammal models achieved an R-squared of 0.64 for predicting species abundances in unknown regions and 0.52 for unknown genera; bird models were less accurate, with R-squared values of 0.27 and 0.32 respectively. The researchers then used the 20 independently trained model versions to predict densities per square kilometre for 4,511 mammal and 7,546 bird species across their native extant ranges, producing 40 global abundance maps that carried model uncertainty forward into all subsequent analyses.
From these predictions, the team reconstructed three interrelated dimensions of community structure in every grid cell. The species body mass–abundance relationship, or MAR-SPP, captures how energy is partitioned among competing species, measured as the slope between log-transformed species abundance and log-transformed nominal body mass. The individual mass distribution, or IMD, tallies all individuals across the range of body masses regardless of species identity, fitted as a power-law exponent using maximum likelihood estimation. The richness mass distribution, or RMD, counts species across body masses and reflects how body size influences ecological opportunity for diversification. The logic connecting them is geometric: if species richness declines with body mass more slowly than energy availability does, the MAR-SPP slope should be negative, reflecting the familiar pattern of smaller populations in larger species.
The global results are striking. MAR-SPP slopes ranged from -0.69 to -0.35 along the gradient of ecosystem productivity, consistently flatter than the -0.75 benchmark of energetic equivalence. IMD slopes, by contrast, ranged from -1.67 to -1.33, consistently steeper than both -0.75 and -1. This combination implies a paradox: because metabolic rate scales with mass to the 0.75 power, a MAR-SPP flatter than -0.75 means larger species capture more energy on average, while an IMD steeper than -1 means smaller organisms collectively dominate ecosystem energy flow. Both statements are true simultaneously. The reconciliation lies in species richness, which declines with body mass: small-bodied animals dominate numerically, but their abundance is diluted across a disproportionately higher number of species, thinning the energy share each small species receives.
Ecosystem productivity emerged as the strongest driver of these patterns. Increasing net primary productivity had a near identical positive effect on MAR-SPP and IMD slopes — meaning small species became relatively less abundant in productive environments — but only a small negative effect on RMD. In lush rainforests, the ecological space occupied by small-bodied species becomes increasingly crowded, intensifying competition and promoting niche specialisation, so each small-bodied niche supports fewer individuals. Meanwhile, the ecological space for large organisms remains relatively unsaturated, allowing them to accumulate energy more effectively, albeit with higher extinction risk from lower abundances. Human activity produced a similar, though less pronounced, shift — but through a different mechanism. Rather than boosting the energy capture of large species, human pressure steepened both IMD and RMD, reflecting the disproportionate extirpation of large-bodied animals from local communities.
The analysis also exposed differences between birds and mammals. Mammal communities showed steeper IMD values (-1.53 versus -1.46 for birds) and flatter MAR-SPP values (-0.61 versus -0.43), suggesting mammals face stronger ecological constraints on the energy capture of larger organisms. Yet RMD values were nearly identical between taxa, indicating that the distribution of ecological opportunity for diversification across body masses is remarkably stable regardless of differences in individual abundance. Notably, the effect of human footprint on body mass–abundance-richness structure was consistent across both groups, revealing that human activity reshapes energy distribution in the same way whether the community is feathered or furred.
The study’s authors caution that their models rely on species-level nominal body masses rather than individual measurements, and that within-species size structure — most individuals in rapidly reproducing taxa being small juveniles — could inflate the observed slopes. But because such biases are expected to be consistent across the dataset, the relative patterns among MAR-SPP, IMD and RMD are likely preserved. The broader implications are considerable. The shifts in body mass–abundance-richness structure offer a promising functional metric for global biodiversity assessments and offset strategies, particularly for addressing the risk of underestimating the ecological importance and vulnerability of large-bodied species. As human activities continue to strip large animals from ecosystems worldwide, the energy landscape those ecosystems support — and the functional organisation of the communities that inhabit them — is being rewritten in ways that will outlast the losses themselves.
Subject of Research: Body mass–abundance relationships reveal uneven global energy distribution across body size classes in vertebrates
Article Title: Body mass–abundance relationships reveal uneven global energy distribution across body size classes in vertebrates
Article References: Camacho, L. F., & Araújo, M. B. (2026). Body mass–abundance relationships reveal uneven global energy distribution across body size classes in vertebrates. Frontiers of Biogeography, 19, Article e164408. https://doi.org/10.21425/fob.19.164408
Image Credits: AI Generated
Keywords: Body, mass, abundance, relationships, reveal, uneven, global, energy, distribution, across, size, classes
Cite Scienmag News
Violet Maxwell. (October 17, 2026). Body mass–abundance relationships reveal uneven global energy distribution across body size classes in vertebrates. Scienmag. https://scienmag.com/body-mass-abundance-relationships-reveal-uneven-global-energy-distribution-across-body-size-classes-in-vertebrates/
Violet Maxwell. "Body mass–abundance relationships reveal uneven global energy distribution across body size classes in vertebrates." Scienmag, 17 October 2026, https://scienmag.com/body-mass-abundance-relationships-reveal-uneven-global-energy-distribution-across-body-size-classes-in-vertebrates/. Accessed 17 October 2026.
Violet Maxwell. "Body mass–abundance relationships reveal uneven global energy distribution across body size classes in vertebrates." Scienmag. October 17, 2026. https://scienmag.com/body-mass-abundance-relationships-reveal-uneven-global-energy-distribution-across-body-size-classes-in-vertebrates/


