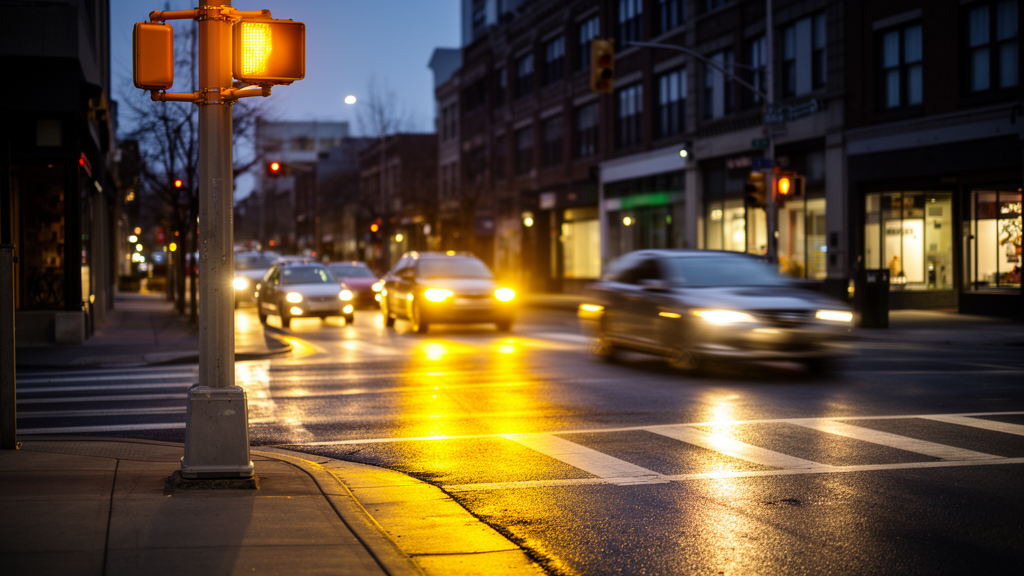
At a busy signalised intersection in Thessaloniki, Greece, researchers have built an artificial intelligence system that watches traffic from above and predicts, with more than 92 percent accuracy, whether each approaching driver will stop or accelerate when the light turns yellow. The work, published in European Transport Research Review, combines drone footage, computer vision and a compact neural network to model one of the most consequential split-second decisions in road traffic: the stop-or-go choice made inside the so-called dilemma zone.
The dilemma zone is the stretch of road just before a signalised intersection where, at the onset of the yellow phase, a driver can neither comfortably brake to a stop nor safely clear the intersection before the signal changes. Decisions made in this zone carry a heavy safety cost. Accelerating through a yellow light can lead to red-light running and right-angle crashes with crossing traffic, while braking abruptly raises the probability of rear-end collisions. Vulnerable road users such as pedestrians and cyclists are disproportionately exposed to these conflicts in urban areas, where road accidents remain a major global burden, causing nearly 1.9 million deaths and 20 to 50 million injuries each year according to figures cited in the study.
Over 12 days in March and April 2018 they recorded 289 videos totalling 720 minutes of footage, observing 617 vehicles approaching the intersection as the signal turned yellow. The road segment, operating under free-flowing conditions with roughly 1,500 vehicles per hour against a capacity of about 6,000 and a speed limit of 70 km/h, offered an environment free of congestion effects that could otherwise distort the behavioural patterns under study.
The raw video was processed by an automated Vision-AI pipeline. A deformable detection transformer, trained on roughly 1,000 manually annotated frames containing 7,165 labelled vehicle instances, identified cars, buses, vans and trucks in each frame. A tracking model called TADN then linked detections across frames, maintaining unique vehicle identities through occlusions and changing light conditions. The tracking system achieved a Multiple Object Tracking Accuracy of 91.4 percent, an IDF1 score of 90.6 percent and a HOTA score of 87.3 percent on validation data. A planar homography transformation converted pixel coordinates into real-world metres, so that velocities and accelerations reflected genuine vehicle kinematics rather than perspective distortion from the oblique aerial viewpoint.
After filtering steps that isolated the relevant approach lanes, removed erroneous tracks and discarded trajectories that never reached the intersection, the team assembled a dilemma zone dataset of 11,665 vehicle trajectories annotated with stop or go decisions. Of these, 45.49 percent of vehicles crossed the intersection during the yellow phase while 54.51 percent stopped. Passenger cars dominated the sample at 97.02 percent, with vans accounting for 2.59 percent and buses just 0.39 percent, a distribution the authors flag as a site-specific characteristic that may limit the reliability of conclusions about heavy-vehicle behaviour.
The prediction model itself is a multi-layer perceptron, a type of neural network with two hidden layers of 16 neurons each, fed by six features computed strictly before the decision moment: velocity, acceleration, vehicle type, lane, distance to the stop line and traffic light timing. Velocity and acceleration were derived from the projected trajectories over a two-second window immediately preceding yellow onset, ensuring no post-decision information leaked into the model. A sigmoid output neuron produced a binary stop-or-go prediction. Evaluated with five-fold cross-validation, with all samples from a given vehicle kept within a single fold to prevent data leakage, the full model reached 92.33 percent test accuracy and an F1-score of 91.76 percent. A logistic regression baseline trained on the same six features managed only 72.54 percent accuracy, a gap the authors attribute to non-linear interactions between features that a linear classifier cannot recover.
An ablation study revealed which features mattered most. A base configuration using only speed, distance to the signal and time to the yellow light already achieved roughly 90 percent accuracy. Adding acceleration improved accuracy by 1.15 percent, the largest single increment, while lane information added 0.86 percent and vehicle type just 0.07 percent. Statistical significance testing with Welch’s t-tests across the cross-validation folds confirmed that acceleration and lane each contributed meaningful improvements, whereas vehicle category alone did not, becoming significant only in combination with lane. The authors interpret the dominance of acceleration through the classical kinematics of the dilemma zone: the stop-or-go decision hinges on whether a driver can brake to a stop or accelerate to clear the intersection within the available time and distance.
The behavioural patterns extracted from the model are striking. Higher acceleration values were generally associated with non-violating behaviour, because they reflect drivers braking in response to the yellow signal, whereas vehicles maintaining constant speed were more likely to cross. For example, a vehicle 50 metres from the stop line travelling at 50 km/h was most likely to cross if speed was held constant, with crossing probability falling as acceleration increased. Lane position produced an unexpected asymmetry: drivers in the rightmost lane appeared more aggressive, potentially running a red light even from 50 metres at 20 km/h, while left-lane drivers behaved conservatively under similar conditions. This contradicts earlier studies linking left-lane use to higher violation risk, but the authors attribute it to the studied intersection’s signal phase plan, which prioritises turning movements from the left lane and gives right-lane drivers extra clearance time.
Vehicle class also shaped behaviour. At the section’s 70 km/h speed limit, the 50 percent crossing-probability threshold for private cars sat at 70 metres from the stop line, while for heavy vehicles and buses it extended to 200 metres. Cars showed a higher probability of conforming behaviour, whereas heavy vehicles were more likely to cross during the yellow or even red phase. Bus drivers displayed a distinctive pattern: within 100 metres of the stop line they avoided violations, but at greater distances and speeds above 50 km/h they were more prone to red-light running, a tendency the authors suggest may stem from cautious braking practices intended to avoid abrupt decelerations that could injure standing passengers.
The researchers are careful to note the limits of their work. The evaluation rests on a single intersection with specific traffic volume, speed limit and geometry, so the lane-specific findings in particular should not be expected to transfer to sites with different signal phasing. The class imbalance in the vehicle fleet and the absence of real-time performance testing on live video feeds remain open issues. Still, the framework’s practical promise is clear: because the model is instantiated per intersection from local drone footage alone, the same pipeline could be redeployed to assess dilemma-zone safety elsewhere, inform signal timing strategies such as dynamic or extended yellow intervals, target enforcement at the lanes and vehicle types most prone to violation, and eventually support connected and autonomous vehicles that must anticipate whether nearby human-driven cars will stop or run the yellow.
Subject of Research: Machine learning prediction of driver stop-or-go decisions in the dilemma zone at signalised intersections
Article Title: Vision-AI-driven dilemma zone modelling for driver behaviour prediction
Article References: Psalta, A., Kopsacheilis, A., Tsironis, V., Politis, I., & Karantzalos, K. (2026). Vision-AI-driven dilemma zone modelling for driver behaviour prediction. European Transport Research Review, 18(1), Article 82. https://doi.org/10.1186/s12544-026-00836-y
Image Credits: AI Generated
DOI: 10.1186/s12544-026-00836-y
Keywords: dilemma zone, driver behaviour, red-light running, computer vision, UAV, deep learning, traffic safety, signalised intersections, multi-layer perceptron, trajectory data, Thessaloniki, yellow signal
Cite Scienmag News
Blake Davidson. (October 30, 2026). AI predicts whether drivers will stop or run yellow lights. Scienmag. https://scienmag.com/ai-predicts-whether-drivers-will-stop-or-run-yellow-lights/
Blake Davidson. "AI predicts whether drivers will stop or run yellow lights." Scienmag, 30 October 2026, https://scienmag.com/ai-predicts-whether-drivers-will-stop-or-run-yellow-lights/. Accessed 30 October 2026.
Blake Davidson. "AI predicts whether drivers will stop or run yellow lights." Scienmag. October 30, 2026. https://scienmag.com/ai-predicts-whether-drivers-will-stop-or-run-yellow-lights/