


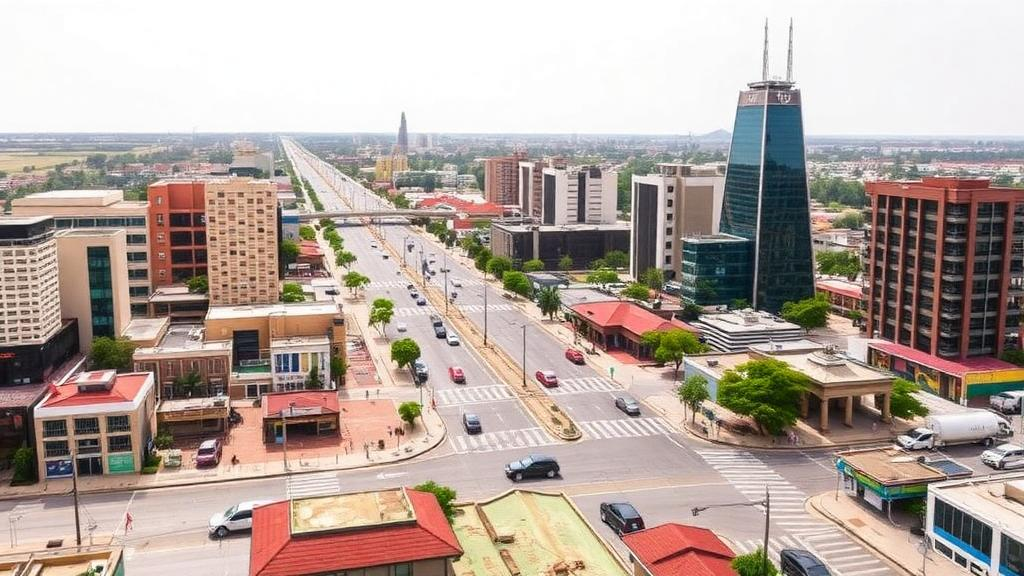
Gaborone, the capital of Botswana, has quietly become one of the fastest-expanding cities on Earth, and a new study has now put hard numbers on what that growth is doing to the land around it. By combining satellite imagery, a random forest classifier, and a one-dimensional convolutional neural network built in TensorFlow, researchers reconstructed three decades of land use and land cover change and projected the city’s footprint a decade into the future. Their results, published in Discover Geoscience, show that built-up areas more than doubled between 1991 and 2021, rising from 15 percent of the study area to 31 percent, while vegetation cover fell from 57 percent to 41 percent. The machine learning models then forecast that by 2031, concrete and rooftops will claim roughly 41 percent of the landscape, with vegetation and farmland continuing to shrink.
The research team, led by Gaositwe Lillian Modutlwe of the University of Botswana together with colleagues at Jagannath University in Bangladesh and the University of Nebraska-Lincoln, chose Gaborone for good reason. The city sits between the Kgale and Oodi Hills in southeastern Botswana, west of the Notwane River, and covers approximately 190 square kilometers at an altitude of about 1,000 meters. With a mean annual rainfall of just 500 millimeters, it is a quintessentially semi-arid urban environment, which makes the loss of vegetated land particularly consequential. According to Botswana’s 2021 Central Statistical Report, the city is home to 246,325 people, more than 10 percent of the country’s entire population, packed into 58,476 households. Much of that population arrived through migration from the rest of the country, drawn by Gaborone’s role as the national economic engine, with industries ranging from diamond cutting and polishing to textiles, brewing, and printing.
To capture how this growth reshaped the land, the team turned to the Landsat archive, the longest continuous record of Earth’s surface collected by the US Geological Survey since 1972. They downloaded imagery for 1991, 2001, 2011, and 2021, deliberately aligning each snapshot with a national census year so that land change could later be compared against demographic data. Cloud and shadow masking was applied across the different Landsat sensors, from the Thematic Mapper of the early 1990s to the Operational Land Imager of today, and the study area was clipped to Gaborone’s administrative boundary. All of the data acquisition, preprocessing, and initial classification ran inside Google Earth Engine, a cloud-computing platform that has become a workhorse for large-scale environmental monitoring because it avoids the overfitting pitfalls that often plague local machine learning setups.
The classification itself relied on random forest, an ensemble algorithm that builds hundreds of decision trees and lets them vote on what each pixel represents. The researchers trained the model on six land cover classes: water, built-up, agriculture, urban forest, vegetation, and bare ground. Crucially, they fed the classifier not just raw spectral bands but six derived spectral indices, each designed to highlight a specific surface property. The Enhanced Vegetation Index captured vegetation vigor while accounting for topographic effects, the Normalized Burn Ratio flagged burnt areas, the Normalized Difference Moisture Index identified agricultural zones under moisture stress, the Normalized Difference Water Index isolated open water, the Normalized Difference Built-up Index delineated urban surfaces, and the Normalized Difference Bareness Index improved detection of exposed soil. A 30-meter digital elevation model from the Shuttle Radar Topographic Mission added terrain information to the mix.
The random forest configuration was tuned through iterative testing, ultimately running 300 decision trees with the square root of the available predictor variables considered at each split. Validation used 600 randomly selected reference points per map, with ground truth drawn from high-resolution imagery in Google Earth Pro going back to 1991. The results were strikingly good: overall accuracy exceeded the widely accepted 80 percent threshold in every year, peaking at 97 percent with a kappa coefficient of 0.96 in 1991, and dipping only to 87 percent with a kappa of 0.84 in 2021. Water was classified perfectly in every epoch, while bare ground proved the hardest class, frequently confused with agriculture and built-up surfaces, a common problem in semi-arid landscapes where bare soil and fallow fields share nearly identical spectral signatures.
With the historical maps in hand, the team then did something most previous Gaborone studies had not: they predicted the future. For this they used a one-dimensional convolutional neural network implemented in TensorFlow Keras on Google Colab. The classified maps from the four census years were exported from Earth Engine and fed into a sequential model consisting of six convolutional layers, each paired with ReLU activation, followed by max pooling to compress dimensionality and extract dominant temporal features. A dropout rate of 0.2 after the second convolutional layer guarded against overfitting, and the flattened outputs passed through two fully connected dense layers before a softmax output layer assigned class probabilities. The choice of a 1D-CNN was deliberate: unlike recurrent architectures, it extracts local temporal dependencies from short time series with far lower computational cost, and it performs well even when training data is limited, which matters when your entire history consists of four observation dates.
The network’s performance held up under scrutiny. Overall accuracy across the modeled years ranged from 0.82 to 0.88, comfortably above the 80 percent benchmark. Water again achieved precision of 1, built-up areas scored consistently above 0.89 on precision, recall, and F1 measures, and vegetation was reliably predicted with scores between 0.82 and 1. The weak spots were bare ground, which managed a precision of only 0.33 in 1991, and agriculture, which dipped to 0.43 in 2011, both largely attributable to limited training samples for those classes. When the researchers compared predicted against observed land areas for 2001, 2011, and 2021, the agreement was close, with the largest discrepancy for built-up land being just 4.35 square kilometers in 2021, and bigger deviations for agriculture and bare ground in 2011, likely stemming from spectral similarity between those classes and uneven sample sizes.
The projections for 2031 tell a clear story. The model expects built-up area to grow from roughly 76.8 square kilometers, or 31 percent of the city, to 99.6 square kilometers, or 41 percent, with expansion continuing the historical pattern of spreading northward from the area above the Gaborone dam. Vegetation is projected to decline further, and bare ground is expected to shrink from about 16.1 to 8.8 square kilometers, presumably as even the empty fringes get absorbed into the urban fabric. The gain and loss analysis shows built-up land increasing by 7.5 percent from 1991 to 2001, 6.3 percent from 2001 to 2011, and 2.4 percent from 2011 to 2021, a decelerating trend that the model expects to reverse with a 9.3 percent gain by 2031. The steepest losses fell on urban forest, down 8.9 percent between 2001 and 2011, and vegetation, down 8.8 percent between 1991 and 2001.
Perhaps the most compelling finding is the statistical link between people and pavement. Linear regression and Pearson correlation analysis revealed an almost perfect positive relationship between population growth and built-up expansion, with a correlation coefficient of 0.98, while vegetation showed a strong negative correlation of -0.95 and agriculture -0.73. The built-up class gained about 0.0003 units of area for every unit of population increase, and vegetation lost area at essentially the same rate. The analysis also uncovered relationships among the land classes themselves: built-up expansion correlated negatively with vegetation at -0.97, confirming that the city is growing directly at the expense of green cover, while bare ground and water showed a negative relationship of -0.83, suggesting that some areas classified as bare ground were formerly water bodies that dried out.
The authors are candid about the limitations. Four observation dates is a thin temporal foundation for any deep learning model, and the population variable served as a proxy for a bundle of interacting socioeconomic processes rather than being explicitly integrated into the prediction itself. Future work, they suggest, should incorporate longer time series, higher-resolution imagery, and ancillary data such as infrastructure networks and socioeconomic indicators, and should embed demographic drivers directly into the modeling pipeline. Still, the implications of the 2031 forecast are hard to ignore. Expanding impervious surfaces in an already hot, dry city threaten to intensify urban heat islands, alter runoff patterns, accelerate land degradation, and fragment the remaining pockets of indigenous vegetation, with knock-on effects for biodiversity, water security, and public health. The study’s value lies in giving Botswana’s land managers a quantified, spatially explicit preview of where those pressures will land, and a demonstrated, transferable machine learning framework for doing the same in other rapidly growing semi-arid cities.
Subject of Research: Machine learning-based modelling of historical and future land use and land cover change in Gaborone, Botswana
Article Title: Modelling historical and future land use and land cover change using random forest and TensorFlow 1D-convolution neural networks in Gaborone, Botswana
Article References: Modutlwe, G. L., Kombani, L., Rahman, M. M., & Rana, M. M. S. P. (2026). Modelling historical and future land use and land cover change using random forest and TensorFlow 1D-convolution neural networks in Gaborone, Botswana. Discover Geoscience, 4(1), Article 296. https://doi.org/10.1007/s44288-026-00662-8
Image Credits: AI Generated
DOI: 10.1007/s44288-026-00662-8
Keywords: land use land cover change, random forest, 1D-CNN, TensorFlow, remote sensing, Gaborone, Botswana, urbanization, Landsat, Google Earth Engine, population growth, semi-arid cities
Cite Scienmag News
Violet Maxwell. (October 10, 2026). AI Maps Three Decades of Urban Growth in Botswana’s Fast-Growing Capital. Scienmag. https://scienmag.com/ai-maps-three-decades-of-urban-growth-in-botswanas-fast-growing-capital/
Violet Maxwell. "AI Maps Three Decades of Urban Growth in Botswana’s Fast-Growing Capital." Scienmag, 10 October 2026, https://scienmag.com/ai-maps-three-decades-of-urban-growth-in-botswanas-fast-growing-capital/. Accessed 10 October 2026.
Violet Maxwell. "AI Maps Three Decades of Urban Growth in Botswana’s Fast-Growing Capital." Scienmag. October 10, 2026. https://scienmag.com/ai-maps-three-decades-of-urban-growth-in-botswanas-fast-growing-capital/


