


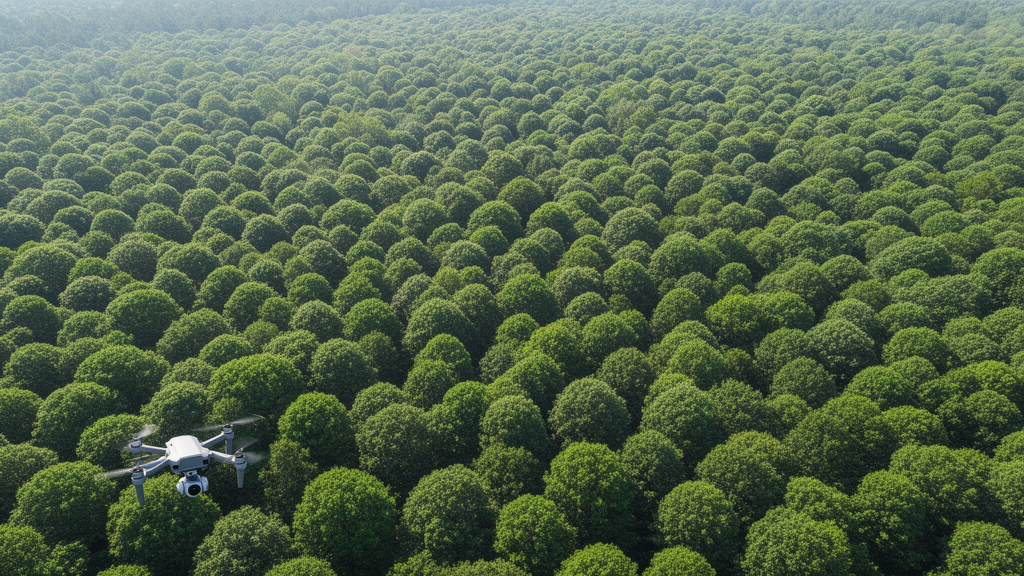
Forests cover roughly 4.06 billion hectares of the planet, nearly a third of Earth’s land surface, and keeping track of what is happening inside them has always been a slow, expensive business. Field crews with measuring tapes can only cover so much ground, and traditional plot-scale surveys are labor-intensive, spatially limited and temporally sparse. Now a team at Sichuan Agricultural University in Ya’an, China, has built an artificial intelligence detector designed to do something deceptively simple and notoriously hard: find and outline individual tree crowns, species by species, in dense drone imagery where the canopies blur into one another. Their model, called DFL-YOLO, is described in a study published in Frontiers in Forests and Global Change.
The problem the researchers set out to solve is not a lack of detectors but a mismatch between generic object detection and the peculiar physics of a forest seen from above. Tree crowns vary enormously in size, from small isolated saplings to vast continuous canopies. Neighboring crowns overlap, shadows and understory vegetation mimic crown edges, and the bounding boxes that a detector must draw around each tree become unstable when dozens of targets crowd the frame. Standard YOLO-style detectors, which process an image in a single pass and are prized for their speed on resource-limited devices, tend to stumble on all three fronts at once. Two-stage detectors that first propose candidate regions and then refine them can be more accurate, but their computational cost makes real-time deployment on edge devices impractical.
DFL-YOLO attacks these coupled errors with a three-stage progressive pipeline built on YOLOv11l, the large variant of the YOLOv11 family. The first stage constructs scale context using structurally pruned Large Selective Kernel modules, or LSK, inserted at the P4 and P5 backbone stages and selected neck locations. Each module runs a 5-by-5 depthwise convolution to capture local detail, followed by a 7-by-7 depthwise convolution with a dilation of 3, giving an effective receptive field of 19 by 19 pixels. The two responses are summed element-wise, and a single-channel spatial weight map, produced by average and maximum channel projections passed through a 7-by-7 convolution and a sigmoid, decides which regions of the preserved input feature to emphasize. Crucially, the team simplified the original LSK design by dropping branch concatenation, dual selection maps and the reconstruction layers, cutting parameters from 56.5 million to 54.5 million while improving mAP@50 by 4.0 percentage points over the unmodified LSK in a controlled comparison.
The second and most novel stage is the Density-Guided Frequency Decoupling Branch, or DFDB, which operates on the context-enhanced P4 feature map. The researchers chose P4 deliberately: P3 has fine spatial detail but weak semantics, P5 has strong semantics but is too coarse to resolve neighboring crown boundaries, while P4 balances the two. DFDB first predicts a single-channel density mask, trained under Gaussian supervision. During training, Gaussian responses centered on each annotated crown are aggregated on the P4 grid, capped at a total response of 3.0 and normalized to the range from 0 to 1, so that overlapping crowns merge into a smooth local-density signal rather than a binary spike. The predicted mask is supervised by mean squared error and, at inference time, is forecast directly from the P4 features.
With the density mask in hand, DFDB splits the P4 feature into frequency components within the spatial domain: a 3-by-3 average-pooling filter yields the low-frequency representation, and residual subtraction yields the high-frequency part. High-frequency responses carry the sharp, boundary-sensitive signals that separate one crown from the next, so the mask M gates the high-frequency branch to enhance boundary detail precisely where crowns are predicted to be crowded. Low-frequency responses carry smooth canopy and background context, so the complementary mask 1−M gates that branch, preserving diffuse context in sparse areas and suppressing it where it might obscure neighboring crowns. A residual link then folds the modulated feature back into the original P4 representation before it is fused with the P3 and P5 paths and passed to the multiscale detection head.
The third stage tackles localization. The Multi-Strategy Weighted Intersection over Union loss, MW-IoU, combines the point-distance geometric constraints of MPDIoU with the non-monotonic dynamic focusing of Wise-IoU and task-oriented soft weights derived during positive-sample assignment. In a controlled comparison on the same YOLOv11l architecture, where only the regression objective changed, MW-IoU reached 83.2% precision and 53.7% mAP@50:95, against 78.5% and 50.5% for the conventional CIoU loss, with identical parameter counts and computational load.
To test the framework, the team built the Mixed NEON dataset by combining a curated subset of RGB imagery from the National Ecological Observatory Network Airborne Observation Platform with images from the open-source Roboflow Tree Dataset. Six NEON sites contributed imagery, including Ordway-Swisher Biological Station, Dead Lake, San Joaquin Experimental Range, Wind River Experimental Forest, Caribou Creek and Bartlett Experimental Forest, with annotations co-registered to 2018 or 2019 acquisitions. The final dataset holds 1,573 images split into 1,373 training and 200 validation images at the image level with a fixed random seed, and 160,102 annotated instances across three classes: Tree, Larch and Other. The training set alone contains 39,065 trees, 44,263 larches and 56,930 other instances, and of 140,258 training instances, 27,069 were small, 30,581 medium and 82,608 large by COCO area thresholds. The authors note an important caveat: because the split was not performed at the site level, images from the same NEON site can appear in both partitions, so the evaluation measures image-level generalization but does not establish strict cross-site independence.
On this benchmark, DFL-YOLO achieved 82.2% mAP@50 and 54.7% mAP@50:95, absolute improvements of 2.6 and 4.2 percentage points over the YOLOv11l baseline, and it outperformed every one of fourteen compared detectors, including YOLOv8l, YOLOv11x, YOLOv12l, YOLOv26l, TPH-YOLO, RT-DETR-L, Faster R-CNN, Cascade R-CNN and Swin-Transformer. The ablation results, however, tell a more nuanced story than a simple stack of wins. LSK alone lifted precision by 4.9 points and mAP@50:95 by 3.6, and DFDB alone delivered gains of 4.9, 2.2, 2.2 and 4.1 points on precision, recall, mAP@50 and mAP@50:95 respectively. Yet some pairings were not additive: adding MW-IoU to LSK alone lowered mAP@50:95 from 54.1% to 53.6%, and adding it to DFDB alone dropped it from 54.6% to 52.3%. The authors are explicit that these results do not support consistently additive or synergistic effects among the three components; only the complete configuration achieved the strongest overall performance. Speed also carries a price: while YOLOv11l processed an image in 14.5 milliseconds, or 68.9 frames per second, DFL-YOLO needed 24.4 milliseconds per image, or 40.9 frames per second.
Stratified analyses reveal where the gains concentrate. Across COCO scale categories, DFL-YOLO raised medium-crown mAP@50 from 53.0% to 61.8% and mAP@50:95 from 28.0% to 33.0%, while small-crown mAP@50 improved only from 10.9% to 12.9%, and large-crown recall actually fell from 76.8% to 63.5% even as its mAP rose. Density-stratified results were more encouraging: in the densest third of validation images, DFL-YOLO improved precision, recall, mAP@50 and mAP@50:95 over the baseline by 5.6, 2.7, 3.0 and 2.0 percentage points respectively, consistent with DFDB’s intended role of sharpening boundaries where crowns overlap. Qualitative activation maps show the predicted density masks tracking the spatial distribution of crowns, with density gating concentrating high-frequency responses around crown regions and attenuating diffuse responses from shadows and surrounding vegetation.
To probe whether the architecture could serve another dense aerial domain, the team retrained all compared models on VisDrone2019, a benchmark of crowded drone scenes far from any forest. DFL-YOLO reached 54.5% mAP@50 and 33.7% mAP@50:95 there, ahead of RT-DETR-L, the strongest competitor by mAP@50, by 6.3 and 3.9 percentage points respectively. The authors stress that this reflects performance after dataset-specific retraining rather than direct cross-domain generalization. Practical limitations remain: the model carries 54.52 million parameters and 126.2 GFLOPs of computational cost, the broad Tree, Larch and Other categories limit species-level interpretation, and small-crown performance and large-crown recall are acknowledged weaknesses. Future work, the team writes, will evaluate independent forest sites with finer taxonomic labels, incorporate multispectral and LiDAR observations, test robustness under motion blur, low illumination and severe occlusion, and pursue pruning and knowledge distillation to lighten the model for mobile deployment. All experiments ran on a single NVIDIA RTX 4090D GPU with the AdamW optimizer, a batch size of 2, 1024-by-1024 inputs and up to 300 epochs, meaning the entire framework was trained and validated on hardware accessible to most research labs.
Subject of Research: Deep learning-based multi-class tree crown detection in UAV forest imagery
Article Title: DFL-YOLO: Density-Guided Frequency Decoupling and Large Selective Kernels improve dense multi-class tree crown detection
Article References: Liu, Y., Mu, J., Zhou, B., Chen, J., Li, X., & Chen, C. (2026). DFL-YOLO: Density-Guided Frequency Decoupling and Large Selective Kernels improve dense multi-class tree crown detection. Frontiers in Forests and Global Change, 9, Article 1964673. https://doi.org/10.3389/ffgc.2026.1964673
Image Credits: AI Generated
DOI: 10.3389/ffgc.2026.1964673
Keywords: tree crown detection, DFL-YOLO, YOLOv11, UAV remote sensing, forest monitoring, large selective kernel, frequency decoupling, bounding box regression, NEON, VisDrone2019, object detection, precision forestry
Cite Scienmag News
Margaret Porter. (October 26, 2026). AI Learns to See the Forest: Density-Guided Detector Maps Crowded Tree Crowns From Drone Images. Scienmag. https://scienmag.com/ai-learns-to-see-the-forest-density-guided-detector-maps-crowded-tree-crowns-from-drone-images/
Margaret Porter. "AI Learns to See the Forest: Density-Guided Detector Maps Crowded Tree Crowns From Drone Images." Scienmag, 26 October 2026, https://scienmag.com/ai-learns-to-see-the-forest-density-guided-detector-maps-crowded-tree-crowns-from-drone-images/. Accessed 26 October 2026.
Margaret Porter. "AI Learns to See the Forest: Density-Guided Detector Maps Crowded Tree Crowns From Drone Images." Scienmag. October 26, 2026. https://scienmag.com/ai-learns-to-see-the-forest-density-guided-detector-maps-crowded-tree-crowns-from-drone-images/


