

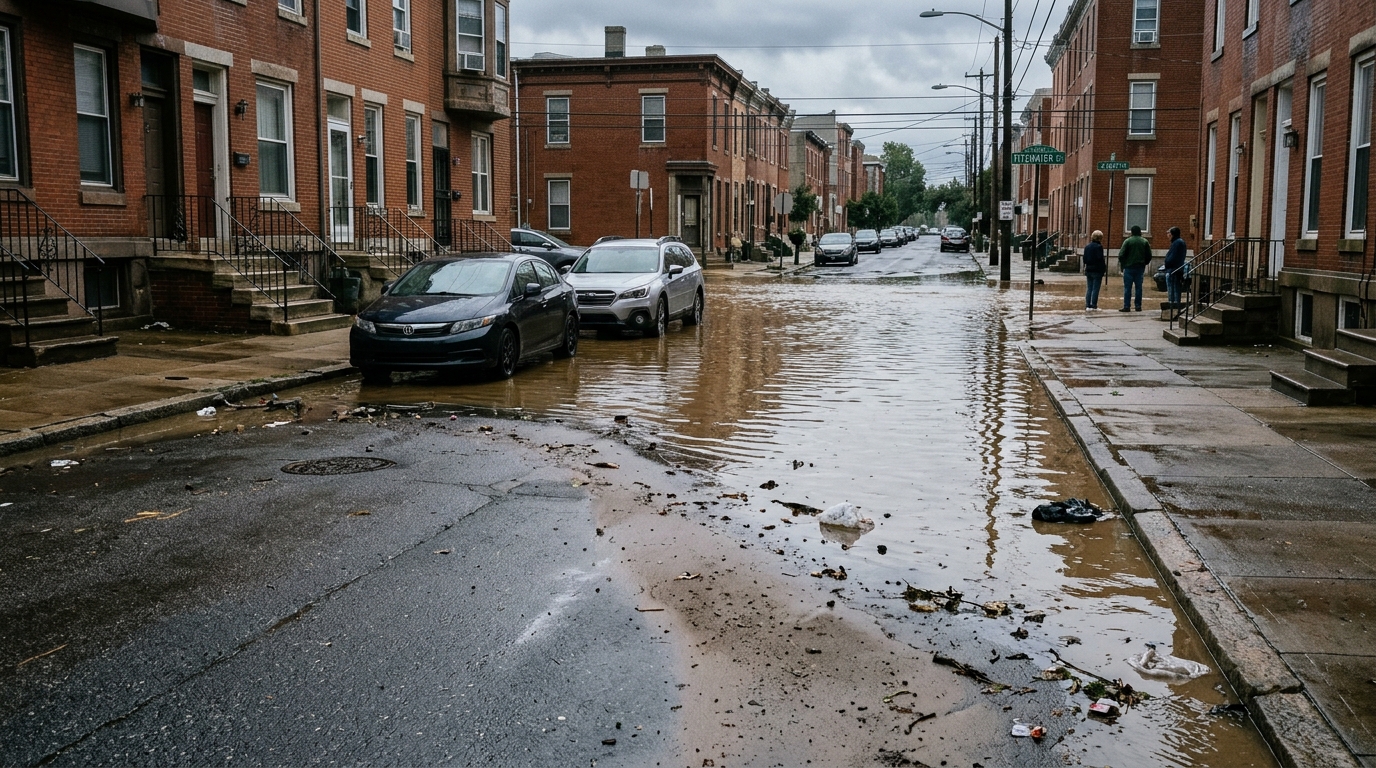
Machine learning has taken another step toward answering one of urban hydrology’s most stubborn questions: how to estimate how deep floodwater will get in a city that has almost no flood measurements of its own. In a study published in the journal Natural Hazards, researchers developed a Random Forest framework that predicts spatially continuous urban pluvial flood water depth using little more than the shape of the terrain, land-use information, and a prescribed rainfall scenario. The work, led by Babak Razdar with colleagues including Paola Mercogliano, was trained and tested in Milan, Italy, and then applied without any retraining to Cologne, Germany, offering a rare direct test of whether terrain-driven flood models can travel between cities.
The motivation is practical. Physically based hydrodynamic models such as SWMM, HEC-RAS, and MIKE URBAN can reproduce urban flood dynamics with considerable realism when fed detailed input data, rigorous calibration, and accurate representations of drainage infrastructure. But those conditions are rarely met. When the underlying digital elevation model, or DEM, is coarse, hydraulic simulations become sensitive to terrain quality, particularly where small-scale conveyance features like canals, culverts, and drainage pathways are missing or smoothed away. The consequences can be non-physical: artificial flow blocking, unrealistic ponding, or unintended release of water from parts of the computational domain. Fixing these problems demands time-consuming terrain preprocessing, and the models themselves carry high computational costs that limit their use for rapid assessment and large-scale screening.
Machine learning offers a different route. Rather than solving the governing hydraulic equations, models such as Random Forest learn empirical relationships between input features, including precipitation, topography, and land cover, and flood response variables. Flood characteristics such as inundation depth are predicted on a grid-cell basis without explicit representation of hydraulic connectivity or detailed drainage networks. That makes them tolerant of incomplete local flow-path information and well suited to screening applications across large areas. The authors chose Random Forest because it balances predictive capability, computational efficiency, and interpretability for large-scale geospatial regression involving heterogeneous predictors, and it requires less extensive hyperparameter optimisation than deep learning approaches. They note that this choice does not imply deep learning is unsuitable; a systematic comparison with convolutional and transformer-based architectures remains a direction for future research.
The training data came from a scenario-based reference dataset developed within the Copernicus Climate Change Service Pluvial Flood Risk Assessment in Urban Areas Service, generated with the Safer_RAIN model, a simplified raster-based filling-and-spilling approach that simulates rainfall accumulation and overflow within hierarchically organised surface depressions under prescribed design storms. The researchers are careful to characterise what these reference maps represent: terrain-controlled flood hazard under specified rainfall scenarios, not complete simulations of all urban hydraulic processes, since the model does not explicitly simulate underground drainage networks, hydraulic structures, or detailed flow routing. Five precipitation return periods, from 5 to 100 years, provided the rainfall forcing, derived from intensity-duration-frequency curves based on a convection-permitting downscaling of the ERA5 reanalysis at roughly 2.2 kilometres for 1989 to 2018.
The predictor set was deliberately narrow. All terrain variables were derived from DEMs without using absolute elevation directly; instead, relative and process-oriented indices captured topographic controls on runoff routing, flow convergence, and water accumulation. These included slope, the Topographic Position Index, the Terrain Ruggedness Index, the Topographic Wetness Index, and mapped topographic depressions or sink areas where runoff accumulates before overflowing. Land-use information came from the CORINE Land Cover 2018 dataset at 100-metre resolution, included as categorical predictors representing differences in imperviousness, surface roughness, and infiltration capacity. Each sample in the dataset represented one raster cell under one precipitation scenario, and the Milan training set at 1-metre resolution reached approximately 55.2 million samples, partitioned with a stratified random 70/30 train-test split.
Ensemble size mattered less than one might expect. Models trained with 50, 100, and 150 trees produced a testing coefficient of determination of 0.6284, 0.6307, and 0.6299 respectively, with 100 trees selected as the best compromise between accuracy, efficiency, and stability. Training the full Milan dataset took roughly 4.5 hours for 100 trees on a single-node high-performance computing cluster, with peak memory around 120 gigabytes, demonstrating near-linear scaling of cost with ensemble size. When applied across the complete Milan domain for each scenario, covering approximately 29.0 million grid cells per scenario, the model achieved coefficients of determination between 0.38 and 0.44, with the highest value for the 25-year event. The authors explain that these moderate values are statistically expected in strongly right-skewed flood-depth distributions, where ensemble averaging smooths sharp gradients and contracts predictions toward central tendencies at the tails, even when absolute error metrics indicate strong practical performance.
The error structure tells a more operational story. Root mean square error and mean absolute error increased progressively with rainfall severity, reflecting the larger magnitude and spatial variability of flood depths under more extreme rainfall, while bias values remained consistently low across all scenarios. Tolerance-based accuracy, which better reflects the needs of hazard mapping and emergency response, stayed high at impact-relevant thresholds: agreement within plus or minus 0.25 metres and plus or minus 0.50 metres remained consistently high across all five scenarios, while accuracy under the strictest plus or minus 0.10-metre tolerance decreased modestly with increasing return period. Predicted depths showed a mild compression of the distribution, with extreme values attenuated and near-zero depths slightly elevated, an effect the authors attribute to the variance-reduction and averaging properties of ensemble regression rather than systematic physical overestimation of flood magnitude.
Interpretability analysis using SHAP values and permutation importance for the 5-year scenario revealed that mapped topographic depressions dominated the model’s behaviour, accounting for approximately 59.07 percent of total SHAP contribution and about 75 percent of permutation importance. Precipitation intensity ranked second by SHAP contribution at 16.28 percent, followed by the Terrain Ruggedness Index at 11.71 percent and land use at 4.92 percent, while slope, TPI, and TWI each contributed less than 3.1 percent. The apparent discrepancy in precipitation’s permutation ranking, where it showed only a small effect, is explained by predictor interactions: because precipitation is encoded through discrete return-period scenarios and interacts with dominant terrain predictors, its contribution can be partially retained through those interactions when it is permuted. The combined hierarchy, with depressions first, then terrain ruggedness, precipitation, and land use, is physically consistent with established understanding of urban pluvial flooding.
The two stress tests produced instructive results. Replacing Milan’s 1-metre LiDAR DEM with the coarser 5-metre EU-DEM degraded performance in a physically consistent way: mean absolute error rose from 0.22 metres for the 5-year event to 0.30 metres for the 100-year event, root mean square error climbed from 0.35 to 0.46 metres, and coefficients of determination fell to between 0.13 and 0.18. Yet median errors stayed at or below 0.06 metres, and even for the 100-year event more than 58 percent and 81 percent of grid cells fell within plus or minus 0.25 metres and plus or minus 0.50 metres of reference depths respectively. Accuracy at the plus or minus 0.25-metre threshold dropped by roughly 16 to 18 percentage points relative to the 1-metre configuration, while the largest relative reductions, about 23 to 27 percentage points, occurred under the strictest threshold, confirming that fine-scale depth variation is what coarse terrain data lose.
Cross-city transfer was the stricter examination. The Milan-trained model was applied directly to Cologne using identical predictors from 1-metre LiDAR data, with no retraining, recalibration, hyperparameter adjustment, or fine-tuning. Across the five scenarios, mean absolute errors ranged from 0.25 to 0.31 metres and root mean square errors from 0.41 to 0.47 metres, with the best performance at the 25-year return period. Between 58.6 and 67.7 percent of grid cells fell within plus or minus 0.25 metres of reference depths, and 78.5 to 83.3 percent within plus or minus 0.50 metres, while coefficients of determination ranged between 0.09 and 0.11 under the strongly skewed flood-depth distribution. Confidence diagnostics proved discriminative under transfer: predictions in the very-high-confidence class achieved approximately 99.9 to 100 percent compliance with the plus or minus 0.25-metre and plus or minus 0.50-metre thresholds, whereas low-confidence predictions reached only 18.2 to 26.7 percent compliance, and low-confidence areas remained a non-negligible 22.7 to 29.9 percent of valid points. The authors conclude that relative terrain structure governs urban pluvial flooding patterns strongly enough to support screening-level flood-depth estimation with medium-resolution DEMs, while noting limitations: the reliance on scenario-based reference depths, the absence of explicit drainage network representation, and the need to evaluate the framework against drainage-aware simulations and observed flood events before operational use in highly engineered urban systems.
Subject of Research: Transferable machine learning prediction of urban pluvial flood water depth using digital elevation models
Article Title: Transferable machine learning prediction of urban pluvial flood water depth using multi-resolution digital elevation models
Article References: Razdar, B., Manco, I., Schiano, P., Reder, A., & Mercogliano, P. (2026). Transferable machine learning prediction of urban pluvial flood water depth using multi-resolution digital elevation models. Natural Hazards, 122(23), Article 718. https://doi.org/10.1007/s11069-026-08456-4
Image Credits: AI Generated
DOI: 10.1007/s11069-026-08456-4
Keywords: urban flooding, pluvial flood, Random Forest, digital elevation model, LiDAR, EU-DEM, flood water depth, Milan, Cologne, machine learning, flood screening, SHAP
Cite Scienmag News
Violet Maxwell. (November 7, 2026). Machine learning maps urban flood depth across cities using terrain data alone. Scienmag. https://scienmag.com/machine-learning-maps-urban-flood-depth-across-cities-using-terrain-data-alone/
Violet Maxwell. "Machine learning maps urban flood depth across cities using terrain data alone." Scienmag, 7 November 2026, https://scienmag.com/machine-learning-maps-urban-flood-depth-across-cities-using-terrain-data-alone/. Accessed 9 November 2026.
Violet Maxwell. "Machine learning maps urban flood depth across cities using terrain data alone." Scienmag. November 7, 2026. https://scienmag.com/machine-learning-maps-urban-flood-depth-across-cities-using-terrain-data-alone/