


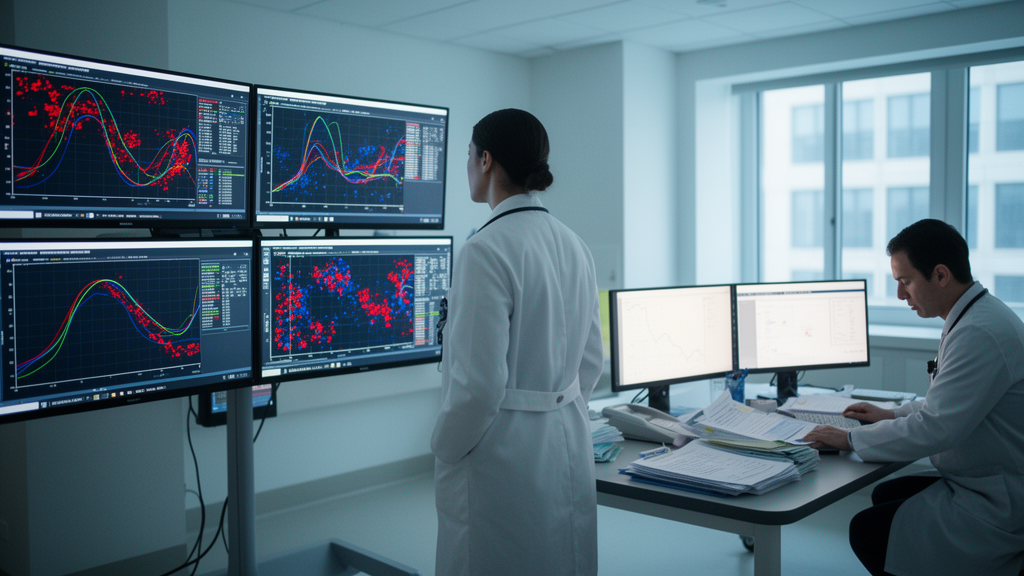
A framework combining a normalized p-control chart with an amplitude-based labeler achieved an overall accuracy of 0.81 when evaluated for its ability to predict the onset of local COVID-19 outbreaks within the following three days. In the retrospective study, the method also achieved mean precision of 0.83 and mean recall of 0.79. The findings support the approach as a way to identify unusual changes in local surveillance data while accounting for fluctuations in daily testing and differences in baseline positivity among areas.
The framework was developed by Yuval Foox, Dan Yamin, Hila Chalutz-BenGal and Irad Ben-Gal as an adaptive outbreak-detection system for COVID-19 surveillance. Its monitored statistic is calculated for each area and day from three inputs: the observed daily test-positivity rate, the number of tests performed that day, and an area-specific baseline positivity estimate derived from recent historical observations. The normalization places these observations on a standardized scale, reducing the influence of variations in testing volume and local baseline levels when signals are compared.
After normalization, the method uses phase II sequential monitoring with fixed three-sigma limits on the normalized scale and Western Electric decision rules. The amplitude-based labeler is used alongside this monitoring process in the proposed outbreak-detection framework. Parameters could be tuned through a temporally ordered training and testing design, with earlier observations used before subsequent data were assessed.
Performance was compared with benchmark outbreak-detection methods considered in the study, while an F-measure provided an additional way to examine trade-offs between precision and recall according to the relative costs of different errors. The study therefore evaluates retrospective detection performance rather than the effectiveness of any intervention. The authors note that this type of health-data analytics may be useful in a post-vaccination setting, when targeted responses to localized increases are prioritized over widespread restrictions, but detection accuracy alone does not demonstrate better disease control.
Subject of Research: Retrospective evaluation of normalized control charts for detecting local COVID-19 outbreaks
Article Title: Applying normalized p-control charts for early detection of local COVID-19 outbreaks
Article References: Foox, Y., Yamin, D., Chalutz-BenGal, H., & Ben-Gal, I. (2026). Applying normalized p-control charts for early detection of local COVID-19 outbreaks. PLOS One, 21(10), e0357183. https://doi.org/10.1371/journal.pone.0357183
Image Credits: AI Generated
DOI: 10.1371/journal.pone.0357183
Keywords: COVID-19, outbreak detection, statistical process control, p-control charts, test positivity, health data analytics, surveillance, early detection, precision and recall, Applying, normalized, p-control
Cite Scienmag News
Blake Davidson. (October 25, 2026). Normalized control charts detect local COVID-19 outbreaks in retrospective study. Scienmag. https://scienmag.com/normalized-control-charts-detect-local-covid-19-outbreaks-in-retrospective-study/
Blake Davidson. "Normalized control charts detect local COVID-19 outbreaks in retrospective study." Scienmag, 25 October 2026, https://scienmag.com/normalized-control-charts-detect-local-covid-19-outbreaks-in-retrospective-study/. Accessed 25 October 2026.
Blake Davidson. "Normalized control charts detect local COVID-19 outbreaks in retrospective study." Scienmag. October 25, 2026. https://scienmag.com/normalized-control-charts-detect-local-covid-19-outbreaks-in-retrospective-study/


