


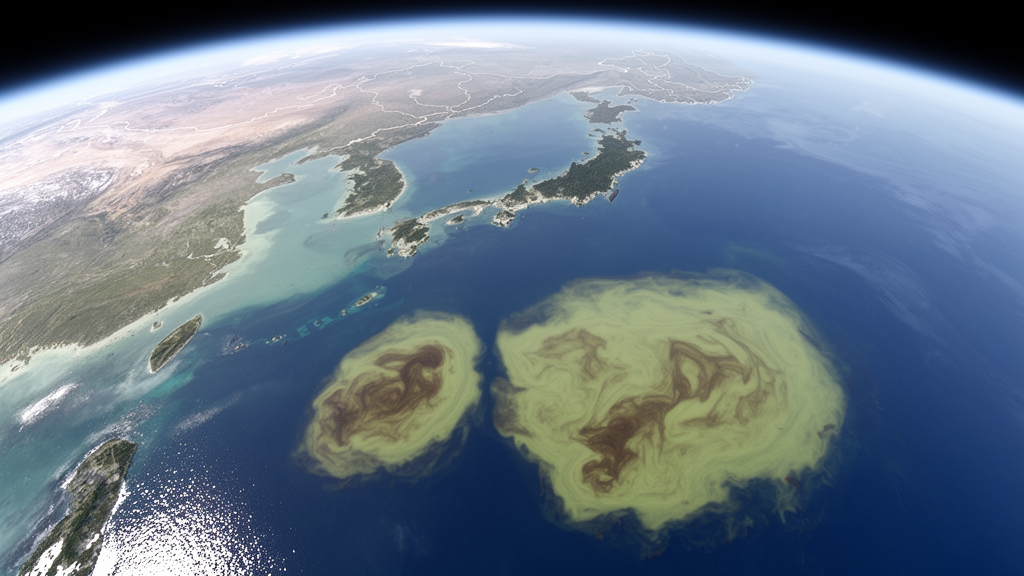
A weekly satellite dataset now provides a species-resolved record of two floating macroalgae across China’s marginal seas from 2018 through 2025. The product maps blooms of Ulva prolifera and Sargassum horneri at 1-km resolution using 85,868 multi-sensor images, according to a preprint under review in Earth System Science Data . It reveals contrasting seasonal and geographic patterns while retaining week-to-week changes that may be obscured by monthly composites.
The dataset is designed as an observational foundation for studying bloom seasonality, interannual variability and rapid transport along China’s coast. The dataset was derived from observations acquired by the Moderate Resolution Imaging Spectroradiometer, or MODIS; the Visible Infrared Imaging Radiometer Suite, or VIIRS; and the Ocean and Land Colour Instrument, or OLCI. The authors said that integrating these complementary satellite observations substantially improved temporal continuity and observation availability compared with single-sensor products.
The resulting weekly record covers eight complete years and distinguishes the two target species rather than presenting all floating macroalgal biomass as one combined signal. Its scope is limited to China’s marginal seas, the study period of 2018–2025 and the satellite-observable surface expression of the two algal species. To create the record, the researchers used a two-step deep-learning approach.
The first step detected and extracted floating macroalgal biomass from the satellite imagery, while the second distinguished U. prolifera from S. horneri . Across the sensors included in the analysis, the workflow achieved more than 90% accuracy for both bloom extraction and species classification. The researchers further evaluated the classifications with hyperspectral data from the Plankton, Aerosol, Cloud and ocean Ecosystem Ocean Color Instrument aboard PACE and multispectral data from the Sentinel-2 MultiSpectral Instrument.
They reported that these independent observations supported the reliability of the species discrimination. Biomass estimates were also broadly consistent when the same bloom areas were compared across satellite sensors. Pair-wise cross-sensor comparisons yielded coefficients of determination, or R² values, above 0.8 for both species.
This means that biomass estimated from two sensors tended to vary together with a strong linear relationship, although the comparison does not mean that every pixel or every date produced identical estimates. The study did not establish that the combination of MODIS, VIIRS and OLCI caused this consistency; it instead reported both the cross-sensor agreement and the multi-sensor product’s improved temporal continuity and observation availability. The choice of a weekly time step emerged as an important feature of the dataset.
Weekly products retain short-term bloom variability while providing a more stable basis for comparisons among years. Daily products were more sensitive to brief fluctuations in biomass, and the authors found that this sensitivity could alter which year was identified as having the highest boom intensity. Monthly composites behaved differently: compared with the weekly products, they underestimated seasonal peak biomass by 24–50% for S. horneri and by 12–52% for U. prolifera during 2018–2025.
The three temporal resolutions therefore presented different views of the same bloom record, with weekly products occupying a middle ground between daily responsiveness and monthly averaging. The spatial results showed that the two species exhibited distinct patterns within the study area. Blooms of U. prolifera in the Yellow Sea followed a relatively consistent seasonal cycle from May through August.
They could aggregate rapidly and dissipate rapidly, and the highest U. prolifera biomass in the dataset was recorded in 2021. S. horneri had a broader and more variable distribution across the East China Sea, with its record-high biomass observed in 2024. These findings describe the satellite record for 2018–2025 rather than establishing universal rules for either species or demonstrating a continuing trend beyond the study period.
Week-by-week observations also resolved bloom aggregation, transport and dissipation processes that were difficult to capture with monthly composites. The weekly sequence showed where biomass became concentrated, how it shifted among mapped coastal areas and when it declined. This temporal detail allows researchers to examine the development of a bloom as a sequence rather than only its monthly average.
The study’s 1-km grid provides a spatially detailed representation of the mapped biomass and the extent of each species, enabling comparisons at a finer scale than the broad regional signals emphasized in the dataset’s stated purpose. The authors assessed the weekly product by comparing its mapped results with previous studies and reported bloom events. They reported that the dataset reliably reproduced previously observed spatial distributions and seasonal characteristics.
Those comparisons provide an additional check on the satellite workflow and the deep-learning method. The validation program was not limited to the same satellite sources used to generate the product: the PACE Ocean Color Instrument provided hyperspectral observations, and Sentinel-2 MSI supplied multispectral imagery for independent checks of species discrimination. Together, the reported validation results support the authors’ conclusion that the weekly maps represent the two species with a generally high degree of accuracy.
As a data resource rather than a field experiment or intervention study, the product provides a consistent framework for investigating how floating macroalgal biomass changes with environmental variability. Separating the species allows researchers to examine U. prolifera in the Yellow Sea and S. horneri in the East China Sea without treating all floating macroalgal coverage as a single phenomenon. Weekly records can support analysis of seasonal timing, peak biomass, aggregation, transport and dissipation, while the common eight-year framework permits comparisons of bloom intensity among years.
The central result is that temporal aggregation can materially change what satellite monitoring reveals about a rapidly changing bloom. Monthly composites may reduce the apparent magnitude of seasonal peaks, while daily products can allow short-lived fluctuations to affect which year appears strongest. Weekly mapping preserves meaningful changes from one week to the next while reducing that sensitivity to individual daily observations.
With a 1-km spatial grid, species-specific identification, more than 90% reported classification accuracy and cross-sensor biomass comparisons yielding R² values above 0.8, the 2018–2025 record offers a detailed and internally consistent way to study two important macroalgal blooms in China’s marginal seas. The work is currently a preprint, so its methods and conclusions remain subject to the journal’s review process.
Subject of Research: Multi-sensor satellite mapping of two floating macroalgal blooms in China’s marginal seas from 2018 to 2025
Article Title: A 1-km weekly dataset of floating Ulva prolifera and Sargassum horneri blooms in China’s marginal seas derived from multi-sensor satellite observations
Article References: Liu, M., Chen, Z., Lu, Y., Xing, Q., Hu, J., Yu, H., Li, Z. B., & Wang, M. (2026). A 1-km weekly dataset of floating Ulva prolifera and Sargassum horneri blooms in China’s marginal seas derived from multi-sensor satellite observations. https://doi.org/10.5194/essd-2026-799
Image Credits: AI Generated
Keywords: macroalgal blooms, remote sensing, satellite imagery, deep learning, Ulva prolifera, Sargassum horneri, Yellow Sea, East China Sea, biomass monitoring, multi-sensor data, weekly, dataset
Cite Scienmag News
Violet Maxwell. (October 21, 2026). Weekly 1-km satellite dataset maps two macroalgal blooms in China’s marginal seas. Scienmag. https://scienmag.com/weekly-1-km-satellite-dataset-maps-two-macroalgal-blooms-in-chinas-marginal-seas/
Violet Maxwell. "Weekly 1-km satellite dataset maps two macroalgal blooms in China’s marginal seas." Scienmag, 21 October 2026, https://scienmag.com/weekly-1-km-satellite-dataset-maps-two-macroalgal-blooms-in-chinas-marginal-seas/. Accessed 21 October 2026.
Violet Maxwell. "Weekly 1-km satellite dataset maps two macroalgal blooms in China’s marginal seas." Scienmag. October 21, 2026. https://scienmag.com/weekly-1-km-satellite-dataset-maps-two-macroalgal-blooms-in-chinas-marginal-seas/


