


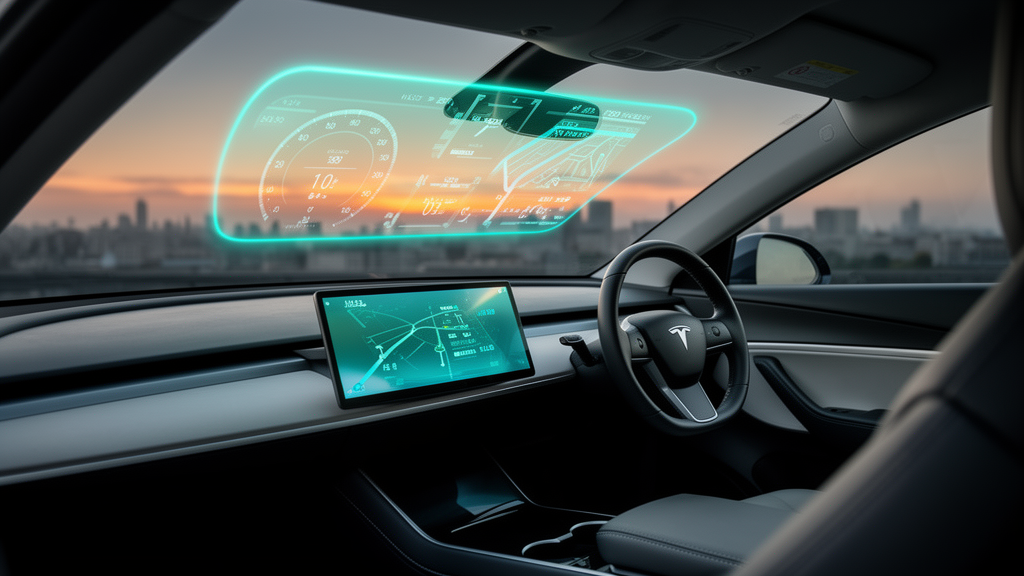
The digital cabin has become the battlefield on which Chinese electric-car makers fight for buyers, and a new analysis has now put numbers on that fight. In a study published in Frontiers in Mechanical Engineering, researchers Weixin Zhu of Ningbo University of Finance and Economics and Xue Xiong of Zhejiang Sci-Tech University applied a data-driven multi-criteria framework to the documented cockpit equipment of 36 model–trim combinations drawn from 13 Chinese battery electric vehicle brands. Their goal was deliberately narrow: to see how recorded equipment differentiates these vehicles, not to crown a single best cockpit. What they found is a striking paradox that should give pause to anyone who reads specification sheets as verdicts. The overall rankings proved remarkably stable under a battery of statistical stress tests, yet the fight for first place came down to a difference of 0.000285 in score — a margin so thin that two vehicles, the ZEEKR 001 and the XPeng P7+, effectively traded the top spot like coin-flip rivals in repeated resampling.
The timing of the study is no accident. In 2025, global electric-car sales passed 20 million units, roughly one quarter of all new-car sales, with China alone accounting for nearly 55 percent of new cars sold as electric or plug-in hybrids, compared with 28 percent in Europe and under 10 percent in the United States. As adoption has surged, the intelligent cockpit — the arrangement of displays, voice interfaces, connectivity, and computing resources that defines the modern digital cabin — has become a much larger market concern. But Zhu and Xiong are careful to distinguish what a specification sheet can and cannot establish. A documented cockpit architecture tells you what equipment exists; it cannot tell you how well a driver completes a task. Human–machine interaction evaluation depends on the user, the task, and the operating conditions, and more interaction channels may expand available functions without reducing the effort needed to use them.
To build their comparison, the researchers constructed two CRITIC–TOPSIS models over four ordered equipment criteria: head-up display level, voice-zone count, 5G availability, and additional-display presence. CRITIC, a method introduced by Diakoulaki and colleagues in 1995, derives weights from the statistical structure of the data itself, combining each criterion’s dispersion across the sample with its conflict against the other criteria. TOPSIS, developed by Hwang and Yoon in 1981, then ranks alternatives by their Euclidean distance from constructed positive and negative ideal vectors. The first model scored configuration richness without price; the second added guide price as a cost criterion. Guide prices ranged from CNY 99,800 to 369,900 across the sample, which covered model years 2024 through 2026 and five coded display architectures, from conventional dual-screen layouts to panoramic and HUD-dominant arrangements.
The weighting results are telling. In the price-free model, HUD technology level received the largest weight at 0.3557, followed by additional displays at 0.3061, 5G at 0.2168, and voice zones at just 0.1215. When price entered the matrix, the order reshuffled: additional displays took the lead at 0.2445, HUD fell to 0.2356, price itself weighed in at 0.2073, 5G at 0.2066, and voice zones again trailed at 0.1061. These weights are properties of the chosen matrix, not findings about engineering importance. A feature present in every sampled vehicle can be practically important while contributing no discrimination here, and a high statistical weight does not establish that HUD accounts for 35.57 percent of cockpit quality. The researchers are explicit that the weights describe how the criteria vary and conflict within this recorded sample.
The rankings themselves reveal both the power and the limits of the approach. ZEEKR 001 topped the price-free model with a score of 0.9453, followed by NIO ES6 at 0.8955. XPeng P7+ and NIO EC6 tied at 0.7020 because their four scored fields coincide exactly — a tie that exposes the coarse resolution of the equipment codes. In the price-adjusted model, ZEEKR 001 scored 0.724159 and XPeng P7+ scored 0.723875, a difference of 0.000285 calculated before rounding. The two baseline rankings correlated at ρ = 0.9644 with the same tie-inclusive top-five set, but agreement weakened at the top-10 boundary, where a tie pushed Model 1 to include 12 cases against Model 2’s 10, yielding Jaccard agreement of 0.6923. A high whole-ranking correlation, in other words, still leaves room for a different shortlist.
The uncertainty analysis is where the study earns its scientific weight. Each model was subjected to 5,000 vehicle resamples and 5,000 brand-block resamples, following the bootstrap principle, with only the CRITIC weights refitted in each draw while the full-sample normalization and all 36 scored alternatives remained fixed. Under vehicle resampling, ZEEKR 001 remained first in the price-free model throughout both schemes. But in the price-adjusted model, the picture changed dramatically: ZEEKR 001 was first in 52.26 percent of vehicle resamples and XPeng P7+ in 47.70 percent; under brand-block resampling, the frequencies were 50.30 percent and 49.06 percent. With 5,000 independent draws, a frequency near 50 percent carries a Monte Carlo standard error of roughly 0.7 percentage points, so these small differences should not be overinterpreted. The 95 percent conditional rank-correlation intervals ran from 0.9271 to 1.0000 for Model 1 and 0.9511 to 0.9990 for Model 2 under vehicle resampling, with brand-block resampling lowering the bounds to 0.9135 and 0.9318.
Criterion-deletion tests proved more disruptive than alternative weighting formulae. Removing HUD collapsed the baseline Spearman correlation to 0.6780 in Model 1 and 0.7498 in Model 2. Omitting additional displays yielded 0.7989 and 0.7166; in Model 2, none of the resulting top-five cases belonged to the baseline top-five set. By contrast, omitting voice zones left correlations above 0.987, indicating lower influence in this matrix rather than lower importance to users. Coding changes had uneven effects: collapsing conventional and AR-HUD to a single presence category gave correlations of 0.8710 and 0.9634, while changing only the AR-HUD step value produced correlations between 0.9809 and 0.9992. Explicit preference scenarios produced the largest differences of all. Giving price 50 percent of the Model 2 weight flipped its correlation with baseline to −0.2262, showing that a cost-prioritized comparison can reverse much of the equipment-based ordering.
Beyond ranking, the researchers built a typology of recurring equipment arrangements using Gower dissimilarity, which accommodates mixed variable types, and partitioning around medoids, which represents groups through observed cases rather than artificial averages. Eight descriptors — display diagonal, independent instrument presence, HUD level, voice-zone count, 5G availability, additional-display presence, processor generation, and display architecture — fed the clustering. Five groups emerged with a mean silhouette width of 0.5193, only slightly above 0.5141 for six groups, so the researchers retained five as a compact working description rather than a uniquely established number of market segments. The clusters ranged from panoramic or wide-display configurations through conventional dual-screen setups with connectivity to comparatively sparse arrangements. Cluster C4, characterized by additional displays, had the highest mean score in both models, but the researchers warn this association is partly built into the analysis because additional displays contribute to both cluster construction and ranking, so it cannot serve as external validation.
Cluster membership proved most sensitive to architectural representation. Omitting display architecture dropped the adjusted Rand index to 0.5133, and omitting processor category gave 0.7350, while omitting display inches or changing HUD coding left membership unchanged. Average-linkage clustering at the same k agreed only partly with PAM, at ARI = 0.7192, showing that the partition depends on the clustering rule even with the dissimilarity matrix held fixed. Leave-one-vehicle-out fits produced ARI values from 0.7514 to 1.0000, and removing an entire brand left rank correlations at minimum 0.9840 and 0.9933. Restriction to the 26 grade-A documentation records gave correlations of 1.0000 and 0.9986, and removing the three vehicles affected by final-verification entries gave 1.0000 and 0.9993, suggesting the retained orderings are relatively insensitive to these omissions even though selection bias and source accuracy remain outside the tests.
The deepest contribution of the study is not a winning cockpit but the uneven resolution of specification-based comparison. Broad orderings persist under several weighting and case-deletion checks, yet removing a major equipment field can change the shortlist, and nominal architectural fields substantially affect group membership. The near-tie between ZEEKR 001 and XPeng P7+ is especially informative: a stable overall ranking can still leave the leading choice unresolved. The researchers suggest a practical use — selecting contrasting configurations for subsequent evaluation, such as cases with similar prices but different instrument and HUD arrangements to motivate matched task comparisons. External validation would require the exact trims to be tested on comparable tasks, measuring completion time, errors, glance behavior, speech recognition under noise, detection responses, subjective workload, and accessibility across user groups. Claims about market-wide configuration prevalence or superior usability, workload, and safety require evidence beyond the specification records analyzed here. In an era when the digital cabin sells cars, the study’s message is clear: the specification sheet is a map of what exists, not a measure of what works.
Subject of Research: Data-driven multi-criteria evaluation of intelligent cockpit configuration strategies in Chinese battery electric vehicles
Article Title: Data-driven multi-criteria evaluation of intelligent cockpit configuration strategies in Chinese battery electric vehicles
Article References: Zhu, W., & Xiong, X. (2026). Data-driven multi-criteria evaluation of intelligent cockpit configuration strategies in Chinese battery electric vehicles. Frontiers in Mechanical Engineering, 12, Article 1976511. https://doi.org/10.3389/fmech.2026.1976511
Image Credits: AI Generated
DOI: 10.3389/fmech.2026.1976511
Keywords: battery electric vehicles, intelligent cockpit, CRITIC-TOPSIS, Gower distance, PAM clustering, head-up display, Chinese EV market, multi-criteria decision-making, Data-driven, multi-criteria, evaluation, intelligent
Cite Scienmag News
Denise Maddox. (October 17, 2026). Head-up displays dominate the data in a new ranking of Chinese electric-car cockpits. Scienmag. https://scienmag.com/head-up-displays-dominate-the-data-in-a-new-ranking-of-chinese-electric-car-cockpits/
Denise Maddox. "Head-up displays dominate the data in a new ranking of Chinese electric-car cockpits." Scienmag, 17 October 2026, https://scienmag.com/head-up-displays-dominate-the-data-in-a-new-ranking-of-chinese-electric-car-cockpits/. Accessed 17 October 2026.
Denise Maddox. "Head-up displays dominate the data in a new ranking of Chinese electric-car cockpits." Scienmag. October 17, 2026. https://scienmag.com/head-up-displays-dominate-the-data-in-a-new-ranking-of-chinese-electric-car-cockpits/


