


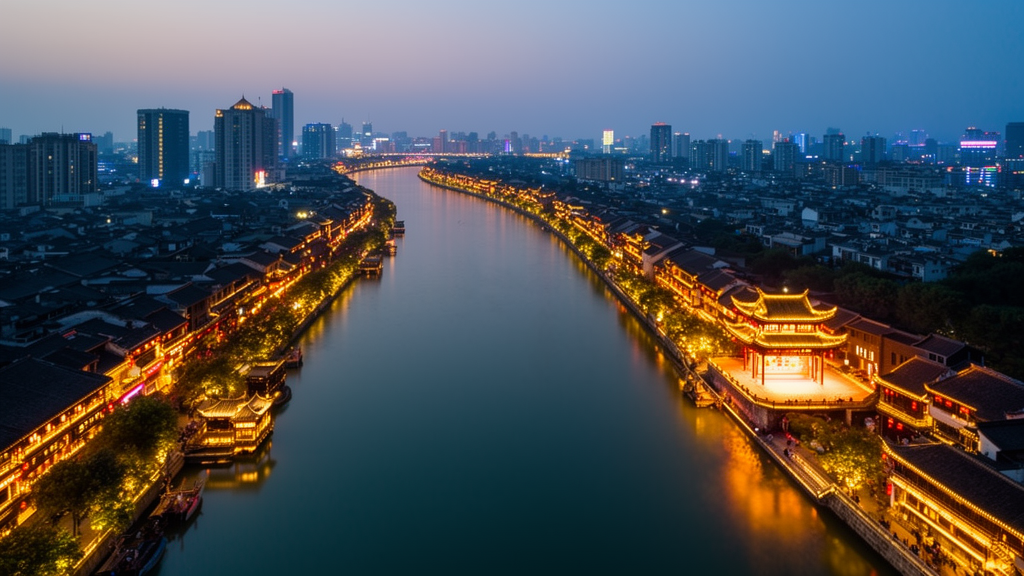
In the province where Kunqu opera was born and where the Grand Canal has carried folk musicians between cities for centuries, a team of Chinese researchers has now mapped something no one has mapped before: the invisible geography of cultural experience itself. Using a 1-kilometre grid stretched across all 13 prefecture-level cities of Jiangsu, Chenghan Zhang of Nanjing University of the Arts and colleagues at South China Agricultural University have quantified where the capacity for cultural ecosystem services lies, where the demand for those services is concentrated, and how far people would theoretically have to travel to reach them. The results, published in Frontiers in Environmental Science, reveal a province drifting quietly toward demand-side imbalance, with deficit clusters expanding year by year along the Yangtze, the Grand Canal and the coastal wetland belt.
Cultural ecosystem services, the non-material benefits people draw from landscapes, include recreation, aesthetic enjoyment and cultural identity. Unlike timber or water provisioning, they cannot be weighed at a dock. Instead, researchers build composite indices. The Jiangsu study assembled nine indicators on a common grid of 101,771 valid cells: six for supply, including landscape naturalness, the Shannon diversity of land cover, proximity to water, music-cultural facility density, road density and transit-stop density; and three for demand, namely residential points of interest, population and built-up share. Music facilities were treated not as ecosystem services themselves but as enabling infrastructure, the concert halls and heritage transmission sites through which ecological settings become cultural experience.
The technical architecture is as important as the findings. Because the six supply indicators and three demand indicators carry unequal cumulative entropy weights, direct subtraction would have mixed a weighting artefact into the spatial contrast. The team therefore normalised entropy-derived weights within each dimension and assigned each block an equal total weight of 0.5, an explicit index-design decision that makes supply and demand comparable on a single relative scale. Count-based indicators were log-transformed and smoothed with a 3-by-3 focal mean before min-max standardisation. Spatial dependence was then tested with row-standardised Queen contiguity matrices, 999 random permutations and false-discovery-rate-adjusted local statistics, the standard machinery of modern spatial econometrics.
What emerged across the 2014, 2019 and 2020 cross-sections is a subtle but coherent shift. Mean supply remained broadly stable, moving from 0.034132 in 2014 to 0.034438 in 2020, while mean demand climbed from 0.034279 to 0.038901. The relative balance index, which was almost perfectly neutral in 2014 at minus 0.000147, slid to minus 0.003555 in 2019 and minus 0.004462 in 2020. The share of positive-balance cells fell from 81.455 percent to 79.659 percent. Under the 70th-percentile threshold used to define strong sources and sinks, source surplus declined while sink deficit rose from 1,054.813 to 1,314.139 in relative index mass, a widening gap between where cultural capacity sits and where potential users are concentrated.
The spatial statistics sharpen the story. Supply clustering weakened slightly, with Moran’s I drifting from 0.759844 to 0.748797, but demand clustering strengthened from 0.806227 to 0.820270, and the clustering of the balance surface itself rose from 0.698529 to 0.735604. All permutation p-values stood at 0.001. More striking are the local indicators: significant low-low balance clusters, spatially coherent deficit areas, expanded from 5,834 cells in 2014 to 7,044 in 2020, while high-high surplus clusters contracted from 214 to 108. Bivariate low-supply, high-demand mismatch locations, the cells where potential pressure outpaces local capacity, nearly tripled from 102 to 336. The province is not losing its cultural geography; it is developing expanding zones where demand is consolidating faster than supply can follow.
To translate imbalance into movement, the team built a source-sink-resistance flow model inspired by the SPAN framework. Strong source and sink cells were identified from the 70th-percentile tails of surplus and deficit, aggregated into connected patches, and retained deterministically until at least 90 percent of strong mass was covered. Flows were then allocated along a travel-time resistance surface derived from OpenStreetMap roads, with speeds of 10 to 100 kilometres per hour by road class and a 12-kilometre-per-hour background for unmapped cells, using Dijkstra’s algorithm to find least-cost paths. Each source’s surplus was distributed among reachable sinks weighted by deficit magnitude and an exponential decay parameter set at 0.02 in the main scenario. The allocation was mass-conserving, with error below 0.04 percent.
The flow results complicate any simple narrative of decline. Allocated pair flow decreased only slightly, from 837.092 in 2014 to 811.768 in 2020, while the flow-weighted mean least-cost time rose from 97.009 minutes to 105.694 minutes. The share of allocated flow reachable within an hour fell from 28.75 percent to 26.58 percent. In other words, the total potential flow barely moved, but reaching it became modestly more expensive in modelled travel time. The 2020 cross-section requires particular caution: the proxy system contains no visitation, ticketing or origin-destination data, so it cannot observe pandemic-related disruption to realised cultural participation. The 2014-to-2019 comparison is therefore treated as the principal temporal contrast, with 2020 retained as a behaviourally exceptional secondary cross-section.
Perhaps the most counterintuitive finding concerns corridor geometry. The team extracted the top 10 percent of positive path-flow cells as a corridor skeleton and measured its connected components under Queen adjacency. Against expectations of fragmentation, the largest-component share rose from 78.32 percent in 2014 to 79.15 percent in 2019 and held at 79.14 percent in 2020, while the number of components fell from 115 to 104. The dominant potential pathway structure became slightly more concentrated, not less. But sensitivity analyses revealed that this stability is scenario-dependent: changing the decay parameter to 0.05 collapsed the largest-component share to around 30 percent, and widening the corridor threshold from the 80th to the 95th percentile swung connectivity from nearly 90 percent to below 40 percent. Corridor fragmentation, the authors conclude, is a property of the modelled flow field under specified assumptions, not direct evidence of physical fragmentation of a cultural corridor.
An independent cross-check with VIIRS nighttime lights lends qualified support to the modelled north-south demand contrast. Area-weighted radiance shares show southern Jiangsu holding 61.40 percent of the provincial settlement-activity index in 2014, easing to 55.47 percent by 2020, while the north rose from 20.55 to 25.07 percent. The south-to-north ratio fell from 2.99 to 2.21, or from 2.35 to 1.74 after normalisation by the fixed 2020 census population. Northern lit-area share climbed from 33.40 percent to 41.44 percent, exceeding the region’s 35.32 percent population share in later years. The direction of the proxy-based demand pattern is consistent with this coarse independent evidence, though agreement in direction does not rule out coverage bias in the points-of-interest layer, and the authors explicitly caution that lower estimated demand-side pressure in the north does not mean northern residents have less cultural interest or participation.
The study’s contribution is deliberately framed as empirical and integrative rather than methodologically novel. The authors stress that their pathway layer represents modelled potential accessibility, not observed cultural movement, and that their demand proxies measure settlement-related pressure rather than realised preference or visitation. For planners, the defensible use is as screening evidence: areas combining significant deficit clusters with high neighbouring demand merit closer local investigation, while high-mass source patches identify potential regional anchors for cultural provision along the water-linked corridor. The broader lesson for the field is methodological humility: report supply-demand imbalance, local spatial association and corridor connectivity together, and always accompany thresholded network indicators with parameter sensitivity. As the authors put it, a single thresholded network should never be mistaken for a fixed physical object. In a province where opera traditions, canal heritage and dense urban systems overlay one of China’s most intricate water networks, the map of cultural possibility is now drawn, but reading it, the researchers insist, requires knowing exactly which assumptions were used to draw the lines.
Subject of Research: Spatiotemporal patterns of cultural ecosystem service supply, demand and service flows along the Jiangsu music–cultural corridor: a grid-based framework across 13 prefecture-level cities
Article Title: Spatiotemporal patterns of cultural ecosystem service supply, demand and service flows along the Jiangsu music–cultural corridor: a grid-based framework across 13 prefecture-level cities
Article References: Zhang, C., Fang, Y., & Wang, Y. (2026). Spatiotemporal patterns of cultural ecosystem service supply, demand and service flows along the Jiangsu music–cultural corridor: a grid-based framework across 13 prefecture-level cities. Frontiers in Environmental Science, 14, Article 1973135. https://doi.org/10.3389/fenvs.2026.1973135
Image Credits: AI Generated
DOI: 10.3389/fenvs.2026.1973135
Keywords: Spatiotemporal, patterns, cultural, ecosystem, service, supply, demand, flows, along, Jiangsu, music, corridor
Cite Scienmag News
Gavin Prescott. (October 16, 2026). Spatiotemporal patterns of cultural ecosystem service supply, demand and service flows along the Jiangsu music–cultural corridor: a grid-based framework across 13 prefecture-level cities. Scienmag. https://scienmag.com/spatiotemporal-patterns-of-cultural-ecosystem-service-supply-demand-and-service-flows-along-the-jiangsu-music-cultural-corridor-a-grid-based-framework-across-13-prefecture-level-cities/
Gavin Prescott. "Spatiotemporal patterns of cultural ecosystem service supply, demand and service flows along the Jiangsu music–cultural corridor: a grid-based framework across 13 prefecture-level cities." Scienmag, 16 October 2026, https://scienmag.com/spatiotemporal-patterns-of-cultural-ecosystem-service-supply-demand-and-service-flows-along-the-jiangsu-music-cultural-corridor-a-grid-based-framework-across-13-prefecture-level-cities/. Accessed 16 October 2026.
Gavin Prescott. "Spatiotemporal patterns of cultural ecosystem service supply, demand and service flows along the Jiangsu music–cultural corridor: a grid-based framework across 13 prefecture-level cities." Scienmag. October 16, 2026. https://scienmag.com/spatiotemporal-patterns-of-cultural-ecosystem-service-supply-demand-and-service-flows-along-the-jiangsu-music-cultural-corridor-a-grid-based-framework-across-13-prefecture-level-cities/


