


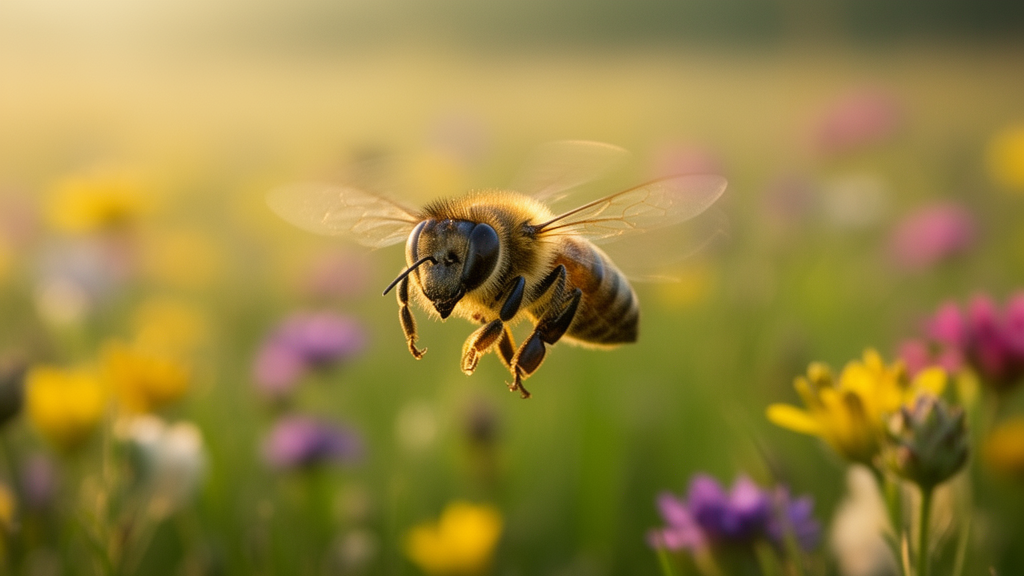
Every spring, a female red mason bee wakes from her cocoon with only a few weeks to live. In that brief window she must find flowers, gather pollen and nectar, and provision the brood cells that will carry her offspring into the next generation. From her perspective, the agricultural landscape surrounding her nest is not a map of fields and forests but a shifting mosaic of blooms that opens and closes with the seasons. A new study published in the Food and Ecological Systems Modelling Journal shows how scientists can reconstruct that shifting floral world inside a computer model, and in doing so offers one of the most detailed looks yet at how wild bee populations might rise or fall depending on the flowers available to them.
The research team applied SolBeePop, a trait-based population model for solitary bees, to field study data collected with Osmia bicornis, the red mason bee, a polylectic spring-active species native to Europe and an important crop pollinator. Rather than treating the landscape as a static backdrop, the investigators built scenarios of floral resource availability at three levels of detail, from a simplified world containing only a single flowering oilseed rape field to a rich representation that incorporated satellite-derived land-cover maps, flowering phenology of trees and meadows, and even the actual pollen compositions found in bee brood provisions. The model outputs were then compared directly to untreated control data from six published field studies conducted across Germany and France, allowing the researchers to assess whether increasingly detailed landscape information improved the model’s ability to reproduce what real bees actually did.
At the heart of the approach lies a crucial insight about how solitary bees experience their environment. Unlike honey bees, which communicate about resource locations and forage in large numbers, a solitary bee conducts a limited number of foraging flights each day and seeks out attractive patches on an individual basis. The SolBeePop model reflects this by using an aggregated landscape representation rather than a fully spatially explicit one. Daily input time series capture weather-dependent foraging opportunities, resource quality from the focal crop, resource quality from non-crop flowering plants, and the proportion of foraging directed at the crop. In combination, these time series determine how much resource a female bee can collect on any given day and, in turn, how efficiently she can provision brood cells. This design makes the model especially useful when detailed data on resource distribution and spatial behaviour are lacking, which is the case for most solitary bee species of interest.
To build the landscape scenarios, the team first compiled a comprehensive review of published pollen analyses from O. bicornis brood provisions across Europe, drawing on studies conducted in Poland, Czechia, Germany, Sweden, Switzerland and Great Britain. The review revealed that pollen from oak trees, Brassicaceae plants including oilseed rape, and buttercups were consistently present in provision samples, while Rosaceae pollen from orchard trees and berries appeared across most studies as well. In studies that sampled provisions at multiple time points, the pollen compositions shifted during the season, reflecting the flowering phenology of the plants. Oilseed rape pollen ranged from zero to 73 percent across studies, and in four studies where flowering oilseed rape fields were explicitly part of the design, the average and maximum proportions of Brassicaceae pollen were higher than in studies without that focus. This generalised picture of floral preferences, independent of any single location, provided the foundation for translating land-cover types into model inputs.
For the medium detail scenario, the researchers used land-cover data from the European Union’s Copernicus Land Monitoring Service, specifically the Corine Land Cover + Backbone dataset with a 10-metre resolution, to characterise the landscapes surrounding each of the six field study sites. Each land-cover class was assigned to plant taxa known to be collected by red mason bees, with woody broadleaved deciduous trees corresponding to oak, maple, walnut, horse chestnut, willow and orchard species, and permanent herbaceous areas corresponding to buttercups and other non-crop herbaceous plants. Flowering times were categorised into date ranges with associated resource availability factors, so that trees provided high resources from late April to mid-May while herbaceous plants peaked from late May to mid-June. The land-cover composition was analysed within three presumed foraging radii of 400, 800 and 1200 metres around each nest location, reflecting the considerable variation in reported foraging distances for the species.
Two alternative approaches were tested for translating land-cover into resource availability. The first, called dist, calculated the shortest distance from the nest to the nearest resource-providing patch and converted it to a quality value based on the assumed foraging radius. The second, called prop, calculated the proportion of the total area within the foraging radius that was covered by resource-providing land covers. The results were striking: using the proportional area approach resulted in much lower assumed resource availability and correspondingly lower simulated brood production, producing outputs more comparable to the simplified low detail scenario. In contrast, the distance-based approach yielded higher resource availability and higher brood production rates. The researchers argue that the distance approach is more plausible from the bee’s perspective, since solitary bees are likely to seek out few attractive resources on a daily basis rather than distributing their foraging effort across the entire landscape in proportion to patch size.
When comparing model outputs to the field study data using normalised root mean square errors, the best relative match was obtained with the high detail scenario using the distance approach and a 1200-metre foraging radius. This scenario incorporated study-specific pollen composition data, with the percentage of Brassica pollen in provisions directly reflecting the proportion of foraging on crop, interpolated linearly between sampling dates. The simulated cumulative brood cell production increased across scenarios, from low to medium to high detail, demonstrating that consideration of multiple floral resources across the landscape and study period improved model performance. Oilseed rape peak flowering was limited to about a week, indicating that resources from the focal field were not optimal throughout the study phases and that floral resources beyond the field were important drivers of brood production. Notably, the bees appeared to seek out oak pollen specifically, even when nest boxes were placed adjacent to flowering oilseed rape fields.
Weather emerged as another critical factor in the simulations. The model assumes that the life span of bees is independent of weather, meaning that time lost to inclement conditions cannot be compensated for by individual bees. Default assumptions were that days with maximum temperatures below 10 degrees Celsius or precipitation of 25.4 millimetres or more did not allow foraging. When the researchers tested an alternative set of thresholds requiring warmer and drier conditions, based on assumptions used in a previous analysis of the species, the number of days available for foraging dropped considerably and simulated brood production fell accordingly. The authors note that published data on weather-dependent foraging in O. bicornis are limited and that more detailed information on thresholds or correlations between foraging activity and temperature, humidity, precipitation, wind speed and solar irradiation could substantially improve the realism of future simulations.
The study also revealed considerable variability in the field data that the model could not explain. Brood cell numbers in one trial, Tübingen 2014, were particularly low, resulting in a stark overestimation by the model even under the scenario that performed best across trials. The researchers suggest that multiple factors could contribute to such variability, including the condition of released cocoons, dispersal behaviour of emerged bees, fine-scale resource availability and unknown environmental influences. This unexplained variability makes it difficult to identify a single best-fitting scenario and highlights the inherent challenges of validating population models against field observations. Nevertheless, the model successfully captured the general pattern of increased brood production when non-crop resources were included, and the authors emphasise that even simplified scenarios provide useful conservative estimates when detailed information is lacking.
The implications extend well beyond the red mason bee. For ecological risk assessment of pesticides, understanding how solitary bees use dynamic agricultural landscapes is essential for estimating potential exposures, since landscape composition alone may not predict exposure well without accounting for food availability, nesting sites and weather. The SolBeePop framework allows researchers to generate scenarios at whatever level of detail the available data support, from conservative assumptions that bees forage only on a treated crop while it is in flower to realistic representations incorporating multiple resources across the season. For polylectic species that use multiple floral sources in parallel, treated and untreated resources should both be considered to estimate realistic exposures. For oligolectic species specialised on one or few plant taxa, a simple landscape representation is likely sufficient because the relevant resources occur in a single land-cover type. The authors conclude that the model represents an important tool for identifying data gaps and research needs, as well as for supporting risk assessments of solitary bee species in complex landscapes, even when knowledge of their floral preferences and spatial behaviour remains incomplete.
Subject of Research: Landscapes from the bee perspective: an application of SolBeePop to field study data
Article Title: Landscapes from the bee perspective: an application of SolBeePop to field study data
Article References: Schmolke, A., Galic, N., & Hinarejos, S. (2025). Landscapes from the bee perspective: an application of SolBeePop to field study data. Food and Ecological Systems Modelling Journal, 6, Article e149273. https://doi.org/10.3897/fmj.6.149273
Image Credits: AI Generated
DOI: 10.3897/fmj.6.149273
Keywords: Landscapes, perspective, application, SolBeePop, field, data, scientific research
Cite Scienmag News
Violet Maxwell. (October 16, 2026). Seeing the landscape through a bee’s eyes: model maps every flower that matters. Scienmag. https://scienmag.com/seeing-the-landscape-through-a-bees-eyes-model-maps-every-flower-that-matters/
Violet Maxwell. "Seeing the landscape through a bee’s eyes: model maps every flower that matters." Scienmag, 16 October 2026, https://scienmag.com/seeing-the-landscape-through-a-bees-eyes-model-maps-every-flower-that-matters/. Accessed 16 October 2026.
Violet Maxwell. "Seeing the landscape through a bee’s eyes: model maps every flower that matters." Scienmag. October 16, 2026. https://scienmag.com/seeing-the-landscape-through-a-bees-eyes-model-maps-every-flower-that-matters/


