
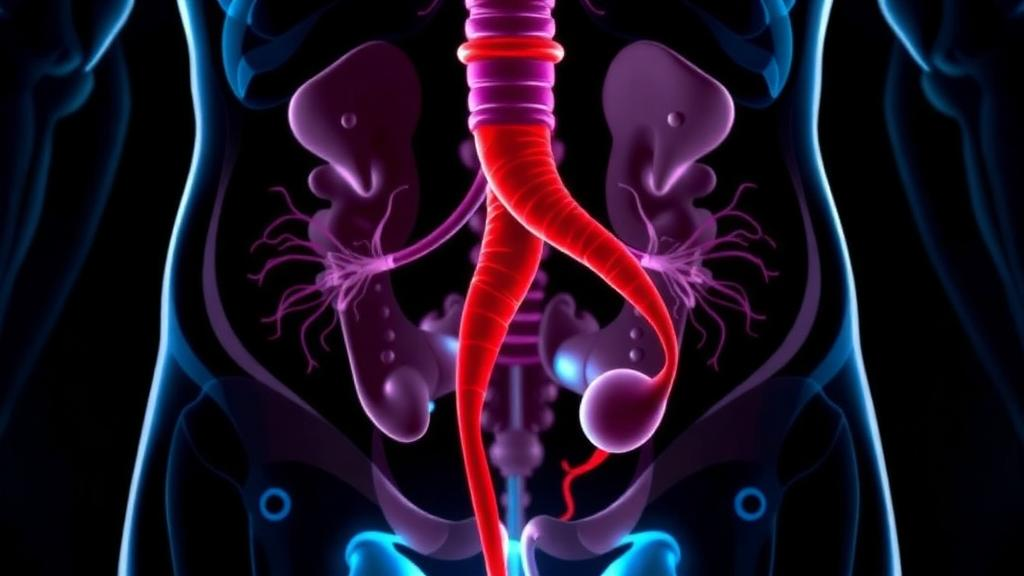
Cancer of the renal pelvis and ureter is an uncommon and unforgiving disease. Known medically as upper tract urothelial carcinoma, or UTUC, it accounts for only a small fraction of urothelial malignancies, yet it behaves aggressively and is often diagnosed at an advanced stage. While most patients are older adults, a meaningful minority are diagnosed before the age of sixty, a group clinicians call early-onset UTUC. These younger patients have historically been lumped together with their elderly counterparts in prognostic models, leaving physicians without a tailored tool to estimate how long they might live or how likely their cancer is to prove fatal. A new study published in BMC Cancer by a team at the Second Hospital of Lanzhou University aims to close that gap with a statistically validated survival calculator built specifically for this younger population.
The research, led by Biao Zhang, Shujun Yang, Su Zhang and corresponding author Panfeng Shang, drew on the Surveillance, Epidemiology, and End Results database, the large population-based cancer registry maintained by the United States National Cancer Institute. The investigators identified patients diagnosed with UTUC between 2004 and 2015 and divided them into two groups: 2,694 early-onset patients and 4,144 elderly patients. The first analytical step was a head-to-head comparison of clinicopathological characteristics between the age groups, followed by survival analyses in both cohorts. The early-onset patients were then split into a training set of 1,886 individuals and an internal validation set of 808 individuals, in a seven-to-three ratio, providing the statistical backbone for model construction and testing.
At the heart of the study is a statistical instrument known as a nomogram. A nomogram is a graphical calculating device that translates the results of a multivariable regression model into a point-based scoring system. Each patient characteristic, such as tumor stage or age, is assigned a number of points proportional to its statistical weight, and the summed total maps onto an estimated probability of surviving for a given number of years. For decades nomograms have been prized in oncology because they outperform crude stage groupings: they integrate continuous variables, weigh each factor according to its independent contribution, and produce individualized estimates rather than population averages. In this study the team built two separate nomograms, one predicting overall survival, which counts deaths from any cause, and one predicting cancer-specific survival, which counts only deaths attributable to the cancer itself.
To determine which variables deserved a place on those nomograms, the researchers used Cox proportional hazards regression, the standard method for modeling the time until an event such as death occurs. For overall survival, the analysis identified age, tumor size, T stage, N stage, M stage, histologic subtype and chemoradiotherapy as independent risk factors. For cancer-specific survival, the independent predictors were age, tumor grade, tumor size, T stage, N stage, M stage, histologic subtype and radiotherapy. The overlap is instructive: the anatomical staging variables that describe how far the tumor has invaded and spread dominate both models, while treatment variables enter in different forms depending on whether the endpoint is death from any cause or death from cancer. Tumor grade, a measure of how abnormal the cancer cells look under the microscope, appears only in the cancer-specific model, which makes biological sense because grade reflects the inherent lethality of the tumor rather than the general health of the patient.
The performance of the two nomograms was assessed with a battery of complementary statistical tests, each answering a different question. The concordance index measures whether the model correctly ranks patients by risk, a value of 0.5 indicating coin-flip accuracy and 1.0 indicating perfect discrimination. Receiver operating characteristic curves and their areas under the curve, or AUC values, quantify how well the model separates patients who die within a fixed time window from those who survive it. Calibration plots compare predicted survival probabilities against observed survival, revealing whether the model is systematically too optimistic or too pessimistic. Decision curve analysis, a more recent addition to the prognostic modeling toolkit, estimates the net clinical benefit of using the model to guide decisions across a range of risk thresholds, weighing the costs of false alarms against the costs of missed high-risk patients.
The reported discrimination figures are strong for a population-based model. For overall survival, the AUC values at one, three, five and eight years were 0.807, 0.774, 0.760 and 0.736 in the training cohort, 0.811, 0.793, 0.763 and 0.752 in the internal validation cohort, and 0.793, 0.767, 0.754 and 0.730 in the external validation cohort. For cancer-specific survival the numbers were even higher: 0.834, 0.822, 0.816 and 0.792 in the training cohort, 0.863, 0.833, 0.811 and 0.820 in internal validation, and 0.819, 0.815, 0.806 and 0.780 in external validation. In practical terms, an AUC above 0.8 is generally considered good discrimination, meaning the cancer-specific model correctly distinguished young patients who died of their disease from those who did not in roughly four out of five pairwise comparisons. The modest decline in accuracy at longer horizons is expected, since competing causes of death and evolving treatments accumulate over time and blur the predictive signal.
Crucially, the team did not rely on internal validation alone, which can flatter a model by testing it on data drawn from the same source population. External validation was performed using an independent cohort of 255 early-onset UTUC patients, and the nomograms retained their accuracy in this outside sample. This step matters because a model that only works within the registry used to build it has limited clinical value. The investigators also plotted Kaplan-Meier survival curves to compare outcomes across risk subgroups defined by the nomogram scores, and these curves showed statistically significant differences in both overall and cancer-specific survival. In other words, when the tool sorts patients into risk categories, those categories genuinely correspond to different survival trajectories, which is the property that would allow a clinician to use the score to triage follow-up intensity or treatment escalation.
Why does early-onset UTUC deserve its own prognostic model in the first place? Younger patients differ from elderly ones in ways that can distort predictions borrowed from general models. They tend to have fewer competing causes of death, so cancer-specific outcomes dominate their survival statistics, and their disease biology, genetic background and exposure profiles may differ from the typical older patient with a smoking history and decades of environmental exposure. By comparing early-onset and elderly patients directly and then modeling the young cohort separately, the Lanzhou team produced estimates that reflect the actual risk landscape facing a forty-five-year-old with a renal pelvis tumor rather than a seventy-five-year-old. The inclusion of histologic subtype as a predictor is also notable, since variants of urothelial carcinoma carry different prognoses and are increasingly recognized as important modifiers of outcome.
The study does carry the limitations inherent to its design. SEER data, while vast and population-based, lack granular clinical details such as lymphovascular invasion, molecular markers, performance status and the specific surgical approach, all of which influence outcomes in modern practice. The diagnostic window of 2004 to 2015 predates the routine use of checkpoint inhibitor immunotherapy in metastatic urothelial carcinoma, so the models cannot account for survival gains from newer systemic therapies. As a registry-based study, it captures what was recorded at the population level, not the full nuance of individual clinical decision-making. The authors acknowledge that the tool is intended to aid prognostic assessment and guide clinical treatment, not to replace clinical judgment, and external validation in contemporary cohorts treated with modern regimens would strengthen confidence in its current applicability.
Nevertheless, the work represents a concrete step toward precision prognostication in a neglected patient subgroup. For a young patient facing a diagnosis of upper tract urothelial carcinoma, an evidence-based estimate of one-, three-, five- and eight-year survival probabilities can inform decisions about the aggressiveness of surgery, the use of perioperative chemotherapy or radiotherapy, and the intensity of surveillance. For researchers, the nomogram provides a risk-stratification framework that future studies of biomarkers and targeted therapies can build upon. As prognostic models in oncology evolve from static stage groupings toward dynamic, individualized calculators, studies like this one demonstrate that even rare cancers in atypical populations can be modeled rigorously when sufficiently large registry data are combined with disciplined statistical validation.
Subject of Research: Development of a SEER-based prognostic nomogram predicting survival in early-onset upper tract urothelial carcinoma
Article Title: Development and validation of a SEER-based prognostic nomogram for patients with early-onset upper tract urothelial carcinoma
Article References: Development and validation of a SEER-based prognostic nomogram for patients with early-onset upper tract urothelial carcinoma. (n.d.). https://doi.org/10.1186/s12885-026-17114-8
Image Credits: AI Generated
DOI: 10.1186/s12885-026-17114-8
Keywords: upper tract urothelial carcinoma, nomogram, SEER database, prognosis, overall survival, cancer-specific survival, Cox regression, early-onset cancer, urological cancer, risk stratification, BMC Cancer, survival prediction
Cite Scienmag News
Nathaniel Bowman. (October 14, 2026). New Survival Calculator Predicts Outcomes in Rare Early-Onset Urinary Tract Cancer. Scienmag. https://scienmag.com/new-survival-calculator-predicts-outcomes-in-rare-early-onset-urinary-tract-cancer/
Nathaniel Bowman. "New Survival Calculator Predicts Outcomes in Rare Early-Onset Urinary Tract Cancer." Scienmag, 14 October 2026, https://scienmag.com/new-survival-calculator-predicts-outcomes-in-rare-early-onset-urinary-tract-cancer/. Accessed 14 October 2026.
Nathaniel Bowman. "New Survival Calculator Predicts Outcomes in Rare Early-Onset Urinary Tract Cancer." Scienmag. October 14, 2026. https://scienmag.com/new-survival-calculator-predicts-outcomes-in-rare-early-onset-urinary-tract-cancer/