


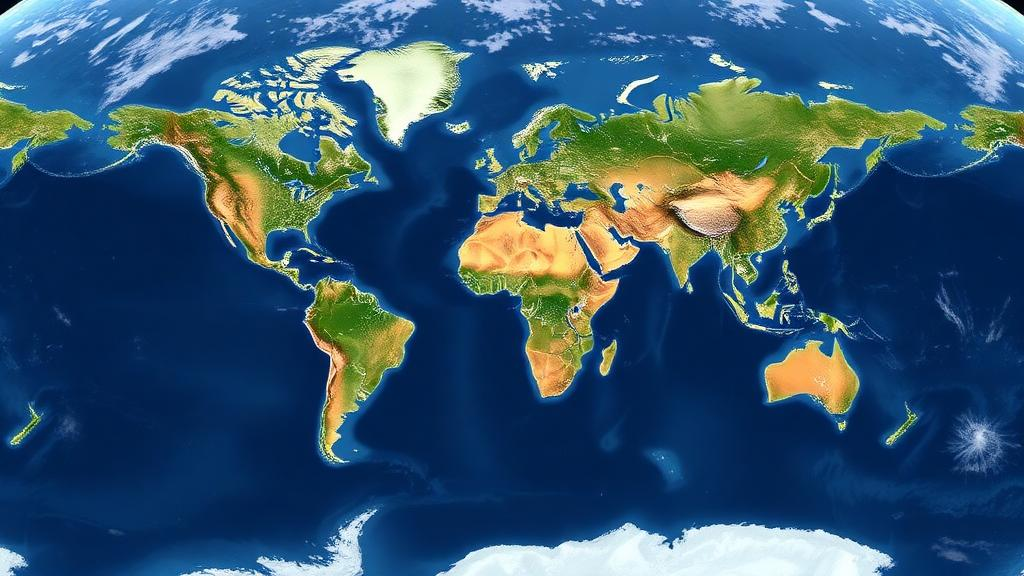
Across the planet, cities are quietly losing elevation. A new study published in Nature Cities has delivered the most consistent global picture yet of urban land subsidence, using satellite radar interferometry to track how the ground beneath 465 major cities—each home to more than one million people—moved between 2014 and 2023. The findings confirm that sinking land is not a localized curiosity but a planetary phenomenon, with severe subsidence concentrated in Southeast Asia, West and Central Asia, and North America, and previously under-studied regions such as South America, Africa, and Russia now clearly visible on the map of a subsiding world.
The technical achievement at the heart of the study lies in its methodology. The researchers drew on interferometric synthetic aperture radar, or InSAR, a technique that compares phase differences between radar images of the same location captured at different times by the European Sentinel-1 satellites. Because the radar signal travels to the ground and back, even millimeter-scale shifts in the surface alter the phase of the returning wave. By combining thousands of such acquisitions in a small-baseline time-series framework, the team constructed high-resolution maps of what they call relative local land subsidence for every city in their sample, all processed with a single, uniform pipeline.
That consistency matters. Earlier global assessments relied on heterogeneous data sources and varying methods, making it difficult to compare one city with another or to prioritize interventions. Previous regional studies had documented dramatic cases—Jakarta’s sinking districts, Mexico City’s century-long descent, the subsiding metropolises of coastal China and Iran’s depleting aquifer basins—but a globally coherent baseline was missing. The new work fills that gap, providing velocity estimates, coherence metrics, and uncertainty measures for all 465 cities, and offering them through an interactive visualization platform built on Google Earth Engine, alongside downloadable maps and publicly released processing code.
One of the study’s central methodological challenges is the distinction between relative and absolute motion. InSAR measures ground movement relative to a reference point, and because radar satellites orbit the Earth rather than sit on it, the resulting velocities can carry systematic biases related to satellite orbits, atmospheric delays, and the choice of reference frame. To address this, the team aligned their relative local land subsidence maps to a global vertical land motion product derived from a worldwide network of GNSS stations. The correction anchors the satellite measurements to an absolute terrestrial reference frame, allowing subsidence in, say, Manila to be compared directly with subsidence in Houston.
Instructively, the researchers found that the broad spatial patterns of subsidence remained largely consistent after this vertical land motion alignment—although the correction introduced additional uncertainty. This is a valuable lesson for the field: relative measurements, carefully referenced, can capture the geography of sinking ground even without absolute anchoring, but the absolute version is essential when subsidence must be combined with sea-level rise projections to estimate flood risk. For coastal cities, where the ocean sets a fixed datum, the difference between relative and absolute subsidence is not academic; it determines how quickly dry land becomes inundated land.
The geographic findings are striking. Southeast Asia emerges as one of the most severely affected regions, a result consistent with decades of local studies implicating intensive groundwater extraction from compressible deltaic sediments. West and Central Asia also stand out, where aquifer depletion beneath arid, rapidly growing cities has produced some of the fastest sinking rates ever measured. North America’s inclusion among the hotspots reflects both well-documented cases, such as Houston’s ongoing descent tied to groundwater pumping and oil extraction, and newer analyses revealing that sizable stretches of the United States coastline are quietly subsiding, compounding the threat of rising seas.
Equally important is what the study reveals in places that have rarely been measured. South America, Africa, and Russia—regions historically under-represented in subsidence literature—show clear signals of ground deformation in the new global maps. This matters because subsidence hazard has often been assumed to be a problem of specific geographies: deltas, coastal plains, and arid zones with heavy irrigation. The new dataset suggests the phenomenon is far more widespread, and that cities without monitoring infrastructure or historical records may nonetheless harbor significant, unrecognized risk. Filling these blind spots is precisely what a uniform global survey can do that scattered national studies cannot.
Beyond mapping where the ground is sinking, the study breaks new ground by tracking how subsidence is changing over time. Using changepoint detection and piecewise regression techniques, the team identified marked deceleration in many cities across Southeast and East Asia—a signal that, in some places, management interventions may be working. Tokyo’s famous turnaround, achieved through strict groundwater regulation after decades of sinking, has long served as the canonical example that subsidence can be halted. The new evidence of deceleration across multiple Asian cities hints that similar dynamics—reduced pumping, artificial aquifer recharge, surface water substitution such as China’s south-to-north water diversion project—may be leaving measurable fingerprints in the satellite record.
Yet the picture is not uniformly hopeful. The researchers found that substantial urban areas within those same regions continue to show accelerating subsidence, meaning that city-level averages can conceal neighborhoods where the ground is falling faster than ever. This spatial heterogeneity is one of the strongest arguments for high-resolution monitoring: a single number for a megacity cannot capture the difference between a district resting on stable bedrock and one sinking into soft lacustrine clay. The trajectory analysis, which distinguishes accelerating, decelerating, and stable zones within individual cities, gives planners a tool for targeting adaptation measures—flood defenses, building retrofits, water policy—where they are needed most.
The physical mechanism underlying most of this sinking is well understood. When groundwater is pumped from sand and gravel aquifers interbedded with clays and silts, water pressure that once supported the sediment grains drops, and the fine-grained layers compress. Crucially, much of this compaction is inelastic: once the aquifer skeleton collapses, it does not rebound when pumping stops, meaning lost aquifer storage capacity is permanently forfeited. Add the weight of dense urban construction, natural sediment compaction in deltas, drainage of organic soils, and in some places tectonic motion, and cities face a compound hazard in which sinking land amplifies every other consequence of climate change, from storm surge to river flooding.
What makes this study likely to resonate far beyond the geodesy community is its timing and its openness. With coastal populations growing and climate-driven sea-level rise accelerating, the intersection of sinking land and rising water is one of the defining risk multipliers of the century. By releasing the full subsidence maps, the code that produced them, and an interactive global viewer, the research team has transformed what was once scattered specialist knowledge into a shared public resource. City governments, insurers, and engineers can now locate themselves on a common global baseline, and the deceleration signals documented in parts of Asia offer something rare in climate adaptation: evidence that determined policy can visibly bend the curve of a hazard measured from orbit.
Subject of Research: Global satellite-based assessment of urban land subsidence and its changing trajectories in 465 major cities
Article Title: A global view of urban land subsidence and its changing trajectories
Article References: Wang, L., Ao, Z., Tao, S., Hu, X., Hu, X., Ran, Y., Wang, G., Zhao, K., Bai, H., Xiao, J., Xue, B., Zhao, X., Zhang, F., Jiang, K., Lin, Y., Huang, Y., Gao, Y., Jiang, T., Peng, Z., … Fang, J. (2026). A global view of urban land subsidence and its changing trajectories. Nature Cities. https://doi.org/10.1038/s44284-026-00527-8
Image Credits: AI Generated
DOI: 10.1038/s44284-026-00527-8
Keywords: land subsidence, InSAR, urban geohazards, Sentinel-1, groundwater extraction, vertical land motion, sea-level rise, Nature Cities, remote sensing, sinking cities, aquifer compaction, global mapping
Cite Scienmag News
Denise Maddox. (October 12, 2026). Sinking Cities Mapped From Space: Global Radar Survey Reveals Where the Ground Is Falling. Scienmag. https://scienmag.com/sinking-cities-mapped-from-space-global-radar-survey-reveals-where-the-ground-is-falling/
Denise Maddox. "Sinking Cities Mapped From Space: Global Radar Survey Reveals Where the Ground Is Falling." Scienmag, 12 October 2026, https://scienmag.com/sinking-cities-mapped-from-space-global-radar-survey-reveals-where-the-ground-is-falling/. Accessed 12 October 2026.
Denise Maddox. "Sinking Cities Mapped From Space: Global Radar Survey Reveals Where the Ground Is Falling." Scienmag. October 12, 2026. https://scienmag.com/sinking-cities-mapped-from-space-global-radar-survey-reveals-where-the-ground-is-falling/


