


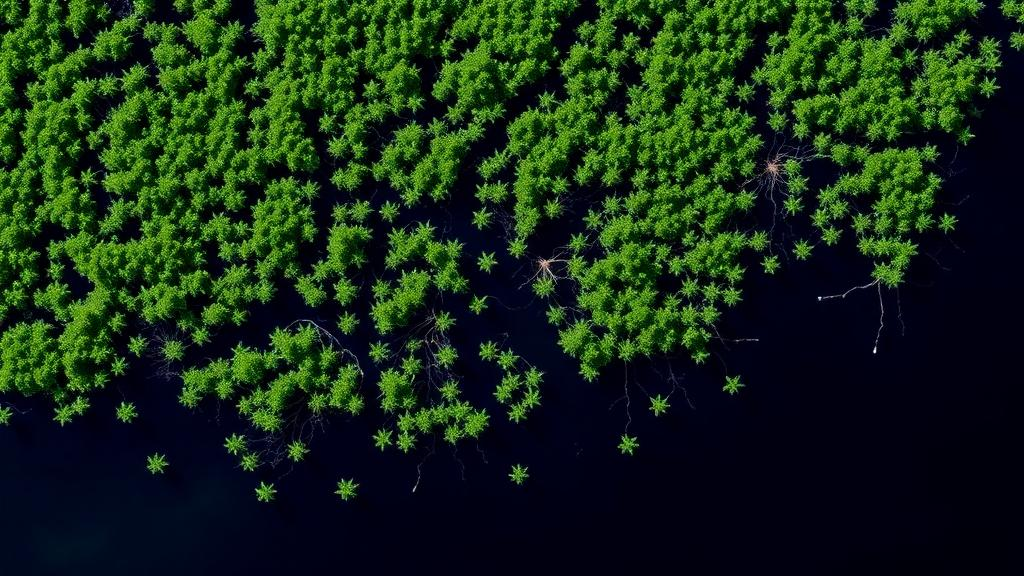
On the southern coast of São Paulo State, Brazil, the mangrove forests of the Cananéia-Iguape Coastal System sit near the subtropical limit of where these remarkable trees can survive. A new satellite-based analysis published in Environmental Monitoring and Assessment has now quantified how rising air temperatures interact with the greenness and structure of these forests, revealing a picture far more nuanced than a simple story of warming benefits. The study, led by Jakeline Baratto of the University of São Paulo with colleagues Paulo Miguel de Bodas Terassi, Nádia Gilma Beserra de Lima, and Emerson Galvani, combined four decades of atmospheric reanalysis data with NASA’s MODIS satellite vegetation records to ask a deceptively simple question: does a warming atmosphere translate into greener, more productive mangroves?
The answer, it turns out, depends on when you look and where you measure. Mean annual air temperature across the mangrove domain increased by approximately 0.02 degrees Celsius per year between 1979 and 2019, equivalent to about 0.20 degrees Celsius per decade, a rate consistent with published warming trends for southeastern Brazil. The fastest warming occurred during the coolest and relatively driest part of the year. The July-to-September quarter warmed at roughly 0.03 degrees Celsius per year, and September alone showed the strongest monthly warming at approximately 0.04 degrees Celsius per year, with statistically significant warming covering about 39 percent of the mapped mangrove area. This seasonal concentration of warming matters because September is a transition month in the estuary, when rainfall begins to recover from its winter minimum while solar radiation and atmospheric water demand climb.
The study area itself is ecologically significant. The Cananéia-Iguape Coastal System spans roughly 3,414 square kilometers across the municipalities of Cananéia, Iguape, and Ilha Comprida, including approximately 125 square kilometers of mapped mangrove. Marine terraces, sandy barrier islands, tidal flats, and estuarine channels create pronounced environmental gradients over short distances, meaning that mangrove stands just kilometers apart can experience very different conditions of salinity, tidal inundation, and freshwater delivery. Much of the mangrove lies within state parks, extractive reserves, and the Juréia-Itatins Ecological Station, which limits direct clearing but does not shield the estuary from hydrological and sedimentary changes originating in the surrounding catchments. At Cananéia, the mean annual air temperature is about 22.1 degrees Celsius and annual precipitation approximately 2,109 millimeters, with rainfall exceeding 200 millimeters per month from January through March and dropping to its lowest values during June through August.
Methodologically, the research harnessed the strengths of two very different data streams. Thermal conditions were represented exclusively by the ERA5 reanalysis of daily mean two-meter air temperature produced by the European Centre for Medium-Range Weather Forecasts, which combines a forecast model with assimilated observations on an atmospheric grid of roughly 0.25 degrees. Vegetation was tracked through three MODIS products: the normalized difference vegetation index (NDVI) and the enhanced vegetation index (EVI) at 250-meter resolution, and the leaf area index (LAI) at 500-meter resolution, all from Collection 6.1. These three metrics are not interchangeable. NDVI summarizes the contrast between red and near-infrared reflectance but can saturate in dense vegetation; EVI corrects for some atmospheric and background effects and remains more responsive at high biomass; LAI is a retrieved structural variable estimating one-sided leaf area per unit of ground area. The common analysis window ran from January 2003 through December 2019, and all processing, from quality filtering to mangrove masking and grid alignment, was performed in Google Earth Engine.
Trend detection relied on the nonparametric Mann-Kendall test paired with Sen’s median slope estimator, robust choices for climate series that may contain outliers and non-normal distributions. Temperature-vegetation associations were quantified with Pearson correlation coefficients and ordinary least-squares regression at three temporal scales: annual, month-specific, and fixed calendar quarters (January-March, April-June, July-September, and October-December). The authors deliberately used calendar quarters rather than standard austral meteorological seasons because these groupings capture four distinct phases of the local annual cycle: peak summer warmth and rainfall, autumn cooling, the coolest and driest interval, and the spring recovery of both temperature and rainfall. Crucially, the team analyzed associations at two spatial scales, averaging across all valid mangrove pixels and also computing cell-by-cell correlations for each 250-meter pixel.
The headline annual result is striking: warmer years were associated with greener mangroves. Annual temperature correlated positively with NDVI (r = 0.61, R² = 0.38, p = 0.009) and with EVI (r = 0.55, R² = 0.30, p = 0.022), suggesting that as the atmosphere warmed, the canopy became more photosynthetically active or denser. Yet the LAI relationship was not statistically significant (r = 0.27, R² = 0.07, p = 0.304), a divergence indicating that greenness and canopy structure did not respond in lockstep. This split between spectral indices and a structural variable may reflect genuine ecological differences in how leaf chemistry and leaf area respond to climate, but it may also stem from the products themselves, which differ in compositing interval, spatial resolution, saturation behavior, and retrieval algorithms.
Within the year, the sign of the association flipped in ways that carry real ecological meaning. During the July-September quarter, NDVI and EVI correlated negatively with temperature (r = -0.31 and -0.28, respectively), while in October-December, EVI and LAI showed positive associations (r = 0.44 and 0.48). In January-March, LAI was strongly and positively associated with temperature (r = 0.61), and in April-June all three indices showed modest positive coefficients. The authors propose a hydroclimatic explanation: during the cool, dry winter interval, relatively warm conditions can raise atmospheric evaporative demand without a matching increase in rainfall, potentially stressing the trees, whereas warmer conditions in summer and spring coincide with recovering freshwater inputs. These mechanisms remain hypotheses, however, because precipitation, salinity, tidal inundation, radiation, and soil moisture were not included in the models.
The spatial maps add another layer of complexity. Significant grid-cell relationships occupied limited and discontinuous areas rather than sweeping across the estuary. Moderate positive EVI coefficients covered about 32 percent of the domain annually, with strong positive coefficients confined to roughly 2.3 percent, concentrated south of Iguape and in central Cananéia. Negative coefficients appeared in parts of Cananéia and southern Ilha do Cardoso, and no single mechanism fully explains them; differences in stand structure, salinity exposure, geomorphology, disturbance history, and the interpolation of the atmospheric field are all candidate factors. A June 2019 disturbance near Papagaios Island, which reduced both NDVI and LAI, illustrates how episodic events can distort relationships summarized by quarter-mean temperature. The authors are equally candid about statistical limitations: thousands of spatial tests were performed without a false discovery rate correction, so isolated significant cells may be false positives, and the coarse ERA5 grid, smoothed by bicubic interpolation onto the 250-meter MODIS grid, cannot resolve tidal-channel microclimates or canopy temperature.
Perhaps the most valuable aspect of the study is its disciplined interpretation. Because the design is observational and bivariate, the authors explicitly caution that the reported correlations should not be read as causal or as responses to temperature alone. The area-mean series provides stronger evidence of warming than the cell-level tests, a contrast consistent with short pixel records, the coarse reanalysis grid, and the absence of corrections for temporal and spatial dependence. The mapped associations describe relationships with a regional atmospheric field, not measurements of stand-level mangrove microclimate. This restraint matters for coastal managers and policymakers who might otherwise overinterpret a positive annual correlation as proof that warming will uniformly benefit mangroves at their subtropical edge.
Looking forward, the research team identifies clear priorities. Temperature should remain part of long-term mangrove monitoring in the Cananéia-Iguape system, but future attribution studies must pair it with precipitation, freshwater discharge, salinity, tidal inundation, and radiation, supported by local sensors and permanent field plots. Models incorporating lagged responses, a four-month rainfall lag has already been reported in this estuary, would provide a firmer foundation. The September transition, where the strongest warming coincides with recovering rainfall and rising atmospheric demand, emerges as the critical window for focused investigation. As mangroves worldwide face rising seas, shifting climates, and mounting human pressure, studies like this one demonstrate both the power of open satellite archives to illuminate remote coastal ecosystems and the care required to translate correlation into understanding.
Subject of Research: Satellite-based assessment of air temperature trends and their associations with mangrove vegetation indices in the Cananéia-Iguape Coastal System, Brazil
Article Title: Assessing mangrove sensitivity to thermal variations through a satellite-based analysis on the southern São Paulo coast, Brazil
Article References: Baratto, J., de Bodas Terassi, P. M., de Lima, N. G. B., & Galvani, E. (2026). Assessing mangrove sensitivity to thermal variations through a satellite-based analysis on the southern São Paulo coast, Brazil. Environmental Monitoring and Assessment, 198(11), Article 1169. https://doi.org/10.1007/s10661-026-16005-6
Image Credits: AI Generated
DOI: 10.1007/s10661-026-16005-6
Keywords: mangroves, climate change, remote sensing, MODIS, ERA5 reanalysis, NDVI, EVI, leaf area index, Mann-Kendall test, São Paulo coast, Cananéia-Iguape estuary, subtropical ecology
Cite Scienmag News
Violet Maxwell. (October 10, 2026). Warming Air, Shifting Green: Satellites Reveal How Brazilian Mangroves Respond to Rising Temperatures. Scienmag. https://scienmag.com/warming-air-shifting-green-satellites-reveal-how-brazilian-mangroves-respond-to-rising-temperatures/
Violet Maxwell. "Warming Air, Shifting Green: Satellites Reveal How Brazilian Mangroves Respond to Rising Temperatures." Scienmag, 10 October 2026, https://scienmag.com/warming-air-shifting-green-satellites-reveal-how-brazilian-mangroves-respond-to-rising-temperatures/. Accessed 10 October 2026.
Violet Maxwell. "Warming Air, Shifting Green: Satellites Reveal How Brazilian Mangroves Respond to Rising Temperatures." Scienmag. October 10, 2026. https://scienmag.com/warming-air-shifting-green-satellites-reveal-how-brazilian-mangroves-respond-to-rising-temperatures/


