


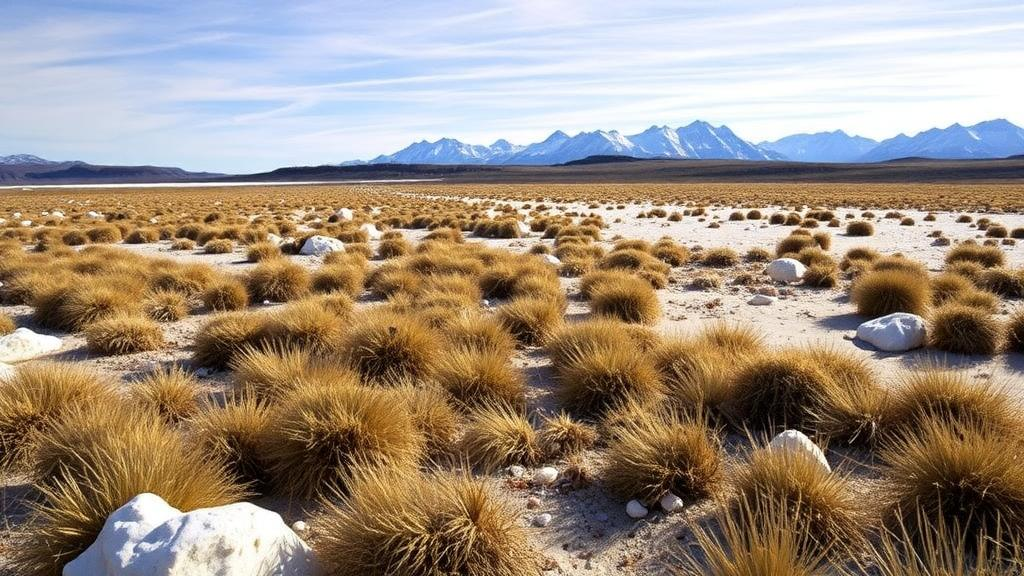
Roughly 23,000 to 19,000 years ago, much of Europe lay under a very different sky. Vast ice sheets buried Scandinavia and the British Isles, and across the unglaciated continent, cold steppes dominated by grasses, wormwood and goosefoot plants stretched to the horizon. Just how cold that world actually was, however, has remained one of the most stubborn puzzles in paleoclimate science. A new study published in the journal Climate of the Past by Gabriel Fénisse of the Centre de Recherches Pétrographiques et Géochimiques in Nancy, France, and colleagues now offers a rigorous methodological overhaul of how scientists translate fossil pollen into numbers, and in doing so delivers one of the most comprehensive quantitative portraits yet of European climate at the Last Glacial Maximum, or LGM.
Pollen grains, preserved in the sediments of lakes, peat bogs and other archives, are among the highest-resolution proxies available for reconstructing past vegetation and climate. Because each plant taxon tolerates a characteristic range of temperature and moisture, the mix of pollen types in a fossil layer can be converted, statistically, into estimates of past climate. The trouble is that the conversion is not unique. Over the past decades, researchers have developed a bewildering variety of reconstruction methods, each resting on different ecological and mathematical assumptions, and the answers they give, particularly for glacial periods, often disagree with one another and with the output of climate models. For warm interglacial intervals such as the Eemian and the Holocene, methods tend to converge. For the deep cold of the LGM, they frequently diverge, leaving the magnitude and spatial pattern of glacial cooling hotly contested.
The new study attacks this problem from two directions at once. First, the team ran three of the most widely used reconstruction techniques side by side on identical data: the Modern Analogue Technique, or MAT, which finds the modern pollen samples most similar to a fossil assemblage and borrows their climates; Weighted Averaging Partial Least Squares regression, or WA-PLS, a transfer function that assumes each taxon responds to climate in a unimodal, Gaussian fashion; and CREST, a probabilistic approach that models the full probability density function of each taxon’s climatic niche and multiplies them into a likelihood distribution. By applying all three to the same 43 fossil pollen sites spanning the LGM across Europe and the Mediterranean, the researchers could isolate the biases intrinsic to each method rather than conflating them with differences in input data.
The second innovation concerns how the modern calibration dataset itself is prepared. The team drew on more than 8,700 modern pollen samples from the Eurasian Modern Pollen Database, version 2, paired with climate data from the ERA5 reanalysis. But instead of feeding the entire continental dataset into the reconstruction algorithms, they used biomization, a technique that classifies pollen assemblages into plant functional types and then into biomes such as tundra, steppe, taiga or temperate forest, to restrict the calibration to ecologically appropriate modern samples. They also applied a coarser megabiomization scheme grouping biomes into six broad categories, from temperate forest to desert, designed to be comparable with global vegetation models. This local calibration strategy is meant to tame the heterogeneity of datasets that span enormous climatic gradients, a problem made worse in Europe by the underrepresentation of truly cold modern climates.
Perhaps the most conceptually elegant advance is a new way of using biome information. Traditionally, researchers identified the single dominant biome, the one with the highest affinity score, and used only its climate signal, discarding everything else. The new study shows that during the LGM this is a serious mistake. At most fossil sites, the scores of competing biomes and megabiomes were nearly tied, indicating transitional vegetation mosaics rather than clear-cut ecosystems. Relying on the winner alone introduces abrupt, artificial jumps in reconstructed temperature whenever the top score changes hands, amplifying threshold effects and statistical noise. Fénisse and colleagues instead computed a weighted mean of climate estimates across all megabiome scores, treating the affinity scores as approximate probabilities. The result is smoother, less noisy reconstructions that still capture the major climatic signals, a change that proved especially consequential for the notoriously jumpy MAT method.
So how cold was Europe at the height of the last ice age? Across the three reconstruction methods and both classification schemes, the study finds that mean annual temperature was on average about 6.4 degrees Celsius colder than today according to the biomization approach, and 6.8 degrees colder using megabiomization, with uncertainties of roughly two degrees. The coldest anomalies, approaching 10 degrees, appear in mountain ranges such as the Alps and the Pyrenees, where all methods agree closely. Summer temperatures of the warmest month were about 3.6 to 5.1 degrees below modern values, while winter temperatures of the coldest month fell by roughly 6.7 to 7.4 degrees, though with far larger scatter between sites and methods. The overall cooling range across individual sites spanned from about 1 to 12 degrees, and the results fall comfortably within the envelope simulated by state-of-the-art climate models, a reassuring sign for the paleoclimate community.
The seasonal picture is particularly revealing. The study finds that LGM seasonality, the difference between summer and winter extremes, was amplified near the Atlantic coasts and reduced in the continental interior relative to present-day conditions, a pattern that agrees well with earlier syntheses from the Paleoclimate Modelling Intercomparison Project. Several sites in southeastern Europe, however, including Lake Xinias and Megali Limni in Greece, show marked increases in seasonality since the LGM, reaching values of around 8 degrees. Winter temperature reconstructions emerge as the weakest link throughout: cross-validation shows errors of at least 3.5 degrees for MAT and CREST, and comparisons with an earlier major synthesis by Davis and colleagues reveal discrepancies of 4 to 6 degrees for winter anomalies, roughly twice those for annual and summer temperatures. The authors attribute this sensitivity to the high spatial variability of winter climate in the modern calibration data and to methodological choices in how calibration samples are selected.
The comparison of calibration strategies yielded a further practical insight. For MAT, which inherently searches for the closest analogues, local biome-based calibration made almost no difference to annual temperature estimates, suggesting the method can be safely applied with global datasets at continental scales. For WA-PLS and CREST, by contrast, local calibration systematically produced colder annual estimates, by about 5 to 6.5 degrees on average, indicating that these methods genuinely benefit from ecologically constrained training sets when cold climates are poorly represented. The choice between the finer biome scheme and the coarser megabiome scheme, meanwhile, turned out to matter surprisingly little, implying that the key distinction between cold and hot arid conditions does not strongly influence the reconstructed LGM climate.
Beyond the numbers, the study delivers a sobering methodological message: much of the apparent climatic volatility recorded in some pollen-based reconstructions may be an artifact of how vegetation classifications are handled rather than a reflection of real climate swings. At the reference site of Lake du Bouchet in the French Massif Central, whose exceptionally rich 56-taxon record served as a test bed, the dominant-biome approach produced large, erratic temperature oscillations driven by competition between steppe and tundra categories, while the weighted-mean approach smoothed these into gradual, physically plausible transitions. The authors argue that explicitly accounting for the uncertainties of biomization algorithms, rather than treating biome assignments as certainties, represents a significant step forward for the field.
The implications extend well beyond academic curiosity. Quantifying LGM cooling in Europe is essential for constraining continental amplification of climate change, for benchmarking the climate models used to project future warming, and for understanding the environments in which Paleolithic humans and late Pleistocene megafauna lived. By showing that a carefully designed multi-method framework, combining analogue matching, transfer functions and probabilistic niche modeling under a common biome-constrained calibration, can produce consistent and defensible estimates, the study provides both a template and a benchmark dataset for future reconstructions. As the authors and their community look toward refining comparisons between proxies and models, the message is clear: the answers hidden in ancient pollen are only as good as the statistical machinery used to read them, and that machinery has just taken a substantial leap in precision.
Subject of Research: Pollen-based multi-method climate reconstruction of Europe during the Last Glacial Maximum
Article Title: Advancing Last Glacial Maximum paleoclimate reconstructions in Europe using pollen data: a multi-method (mega)biomization approach
Article References: Fénisse, G., Chevalier, M., Peyron, O., Bekaert, D. V., & Blard, P.-H. (2026). Advancing Last Glacial Maximum paleoclimate reconstructions in Europe using pollen data: a multi-method (mega)biomization approach. Climate of the Past, 22(8), 1507-1536. https://doi.org/10.5194/cp-22-1507-2026
Image Credits: AI Generated
Keywords: Last Glacial Maximum, paleoclimate reconstruction, fossil pollen, biomization, megabiomes, Modern Analogue Technique, WA-PLS, CREST, Climate of the Past, Europe, temperature anomalies, calibration datasets
Cite Scienmag News
Sloane Callahan. (October 9, 2026). Pollen Secrets of the Ice Age: New Method Sharpens Europe’s Last Glacial Maximum Climate Picture. Scienmag. https://scienmag.com/pollen-secrets-of-the-ice-age-new-method-sharpens-europes-last-glacial-maximum-climate-picture/
Sloane Callahan. "Pollen Secrets of the Ice Age: New Method Sharpens Europe’s Last Glacial Maximum Climate Picture." Scienmag, 9 October 2026, https://scienmag.com/pollen-secrets-of-the-ice-age-new-method-sharpens-europes-last-glacial-maximum-climate-picture/. Accessed 9 October 2026.
Sloane Callahan. "Pollen Secrets of the Ice Age: New Method Sharpens Europe’s Last Glacial Maximum Climate Picture." Scienmag. October 9, 2026. https://scienmag.com/pollen-secrets-of-the-ice-age-new-method-sharpens-europes-last-glacial-maximum-climate-picture/


