


Every wave that rolls toward a coastline carries energy, and for engineers hoping to turn that motion into electricity, the first question is always the same: how much power is actually out there? Answering it has long depended on a patchwork of floating buoys and computer models, each with blind spots. Now a team of European researchers has unveiled a satellite-derived dataset that maps wave energy resources across eleven maritime regions with a resolution fine enough to resolve conditions just a few kilometers from shore. The dataset, called WAPOSAL, short for Wave Power and Satellite Altimetry, was described in the journal Earth System Science Data and covers the years 2011 through 2023.
The regions span an extraordinary range of wave climates. They include Norway and the Baltic Sea, the United Kingdom and the North Sea, the French Atlantic facade, the Atlantic coast of Spain, Portugal, the Mediterranean Sea, and the archipelagos of Madeira, the Canary Islands and the Azores, along with French Guiana in South America and French Polynesia in the Pacific. Together they encompass some of the most energetic wave zones on the planet as well as calmer, fetch-limited basins, making the collection a kind of natural laboratory for comparing how wave energy behaves under very different oceanographic conditions.
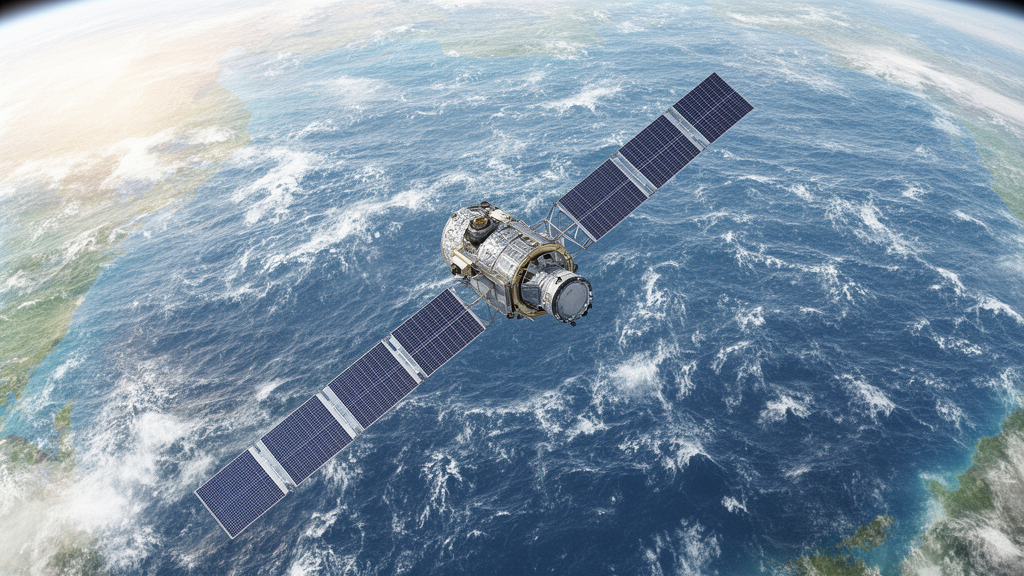
The raw material comes from two European Space Agency missions: CryoSat-2, flying since 2010, and the twin Sentinel-3 satellites launched in 2016 and 2018. Both carry radar altimeters that operate in synthetic aperture radar mode, firing pulses at the sea surface and recording the echoes that bounce back. The shape of those echoes encodes the state of the sea. The team reprocessed the raw measurements using a cloud-based service called SARvatore and an algorithm known as SAMOSA+, which was specifically designed to interpret altimeter waveforms in the difficult nearshore environment, where land contamination and shallow water complicate the signal.
From this retracking procedure the researchers extracted two key quantities along every satellite pass: the significant wave height, a standard measure of the average height of the highest third of waves, and the normalized radar cross-section, which describes how strongly the surface reflects radar energy. The along-track resolution is a remarkable 300 meters, far finer than the grid spacing of typical wave models. Each measurement also carries a quality indicator, a misfit value quantifying how well the theoretical waveform matched the observed one, and samples exceeding a misfit of four counts were discarded as unreliable.
Wave height alone is not enough to calculate wave power, however. The energy flux also depends on the wave period, the time between successive wave crests, which radar altimeters cannot measure directly. The team turned to an empirical relationship first proposed in 2003, which links the zero-crossing wave period to a combination of significant wave height and radar cross-section. Because the original calibration was based on an older satellite and open-ocean buoys, the researchers recalibrated the relationship for each of 82 wave buoys across the study regions, using data from the Copernicus Marine Service and, in the Mediterranean, the Italian national wave network.
The site-by-site calibration matters because the relationship between the radar-derived parameter and wave period is not universal. It shifts with the local wave climate, whether the sea is dominated by locally generated wind waves or by long-period swell arriving from distant storms, with the shape of the wave spectrum, with bathymetric effects in shallow water, and with regional biases in the satellite measurements themselves. A single global calibration, the authors argue, would introduce systematic errors when applied across such heterogeneous environments. The regression coefficients were therefore estimated independently at each buoy location, then interpolated to the coordinates of the satellite footprints so that wave periods could be computed along every track.
Validation against the buoys produced strikingly good numbers. For Sentinel-3A/B, significant wave height showed a bias of just 0.03 meters, a root mean square error of 0.22 meters, and a correlation coefficient of 0.98. The zero-crossing wave period, the harder quantity, achieved a bias of essentially zero, an error of 0.55 seconds, and a correlation of 0.91. CryoSat-2 performed almost identically. In regions without buoys, such as the Azores, French Guiana, French Polynesia, Madeira and the Canary Islands, the team validated against the ERA5 reanalysis instead, matching satellite and reference data within 45 minutes and 40 kilometers and excluding points closer than one kilometer to the coast.
With height and period in hand, computing wave power density is straightforward physics. The formula combines the square of significant wave height with the energy period, scaled by seawater density and gravity, yielding power per meter of wave crest in kilowatts. The energy period was derived from the zero-crossing period using a fixed ratio of 1.18, an assumption the authors flag as a source of uncertainty: for complex, multi-peaked sea states the ratio can vary, introducing errors on the order of 10 to 15 percent, and up to 20 percent in bimodal conditions. The deep-water approximation used in the power formula can also moderately overestimate energy on continental shelves, a limitation the team plans to address with finite-depth formulations in future work.
The performance of the method varies predictably with sea state. Mediterranean sites, dominated by fetch-limited wind seas, showed the highest skill, with wave period correlations reaching 0.89 in the Gulf of Lion. North Atlantic sites exposed to long-period swell and bimodal spectra performed slightly worse, with correlations between 0.8 and 0.85 for period but still 0.96 or higher for wave height. An example time series offshore of São Miguel in the Azores, built from eleven years of CryoSat-2 data and seven years of Sentinel-3 data, tracked the ERA5 reanalysis closely, with biases of 3.5 kilowatts per meter and errors near 10 kilowatts per meter, capturing the pronounced seasonal cycle of winter storms and calm summers.
The dataset is openly available through the European Space Agency’s EarthCODE repository in both netCDF files and cloud-optimized Zarr data cubes, organized by mission and region, licensed for sharing and reuse. For the marine renewable energy community, the implications are considerable: wave energy converters must be sited where the resource is strong, consistent and accessible, and coastal planners need to know how that resource varies from one kilometer to the next. By delivering validated, high-resolution wave power estimates along actual satellite tracks, WAPOSAL offers a standardized foundation for that work, one that complements buoys and models rather than replacing them, and brings the prospect of wave-powered grids a measurable step closer.
Subject of Research: Satellite altimetry-based assessment of wave energy resources and wave power density across multiple maritime regions
Article Title: WAPOSAL: a multi-regional wave dataset from satellite altimetry for significant wave height, period estimation, and wave power density
Article References: Ponce de León, S., Panfilova, M., Orejarena-Rondón, A. F., Restano, M., Sabia, R., & Benveniste, J. (2026). WAPOSAL: a multi-regional wave dataset from satellite altimetry for significant wave height, period estimation, and wave power density. Earth System Science Data, 18(10), 7391-7402. https://doi.org/10.5194/essd-18-7391-2026
Image Credits: AI Generated
DOI: 10.5194/essd-18-7391-2026
Keywords: satellite altimetry, wave power density, significant wave height, wave period, Sentinel-3, CryoSat-2, SAMOSA+ retracker, marine renewable energy, ERA5 reanalysis, wave buoys, ocean waves, coastal engineering
Cite Scienmag News
Violet Maxwell. (October 8, 2026). Satellites Map the Ocean’s Wave Power in Unprecedented Detail Across 11 Regions. Scienmag. https://scienmag.com/satellites-map-the-oceans-wave-power-in-unprecedented-detail-across-11-regions/
Violet Maxwell. "Satellites Map the Ocean’s Wave Power in Unprecedented Detail Across 11 Regions." Scienmag, 8 October 2026, https://scienmag.com/satellites-map-the-oceans-wave-power-in-unprecedented-detail-across-11-regions/. Accessed 8 October 2026.
Violet Maxwell. "Satellites Map the Ocean’s Wave Power in Unprecedented Detail Across 11 Regions." Scienmag. October 8, 2026. https://scienmag.com/satellites-map-the-oceans-wave-power-in-unprecedented-detail-across-11-regions/


