


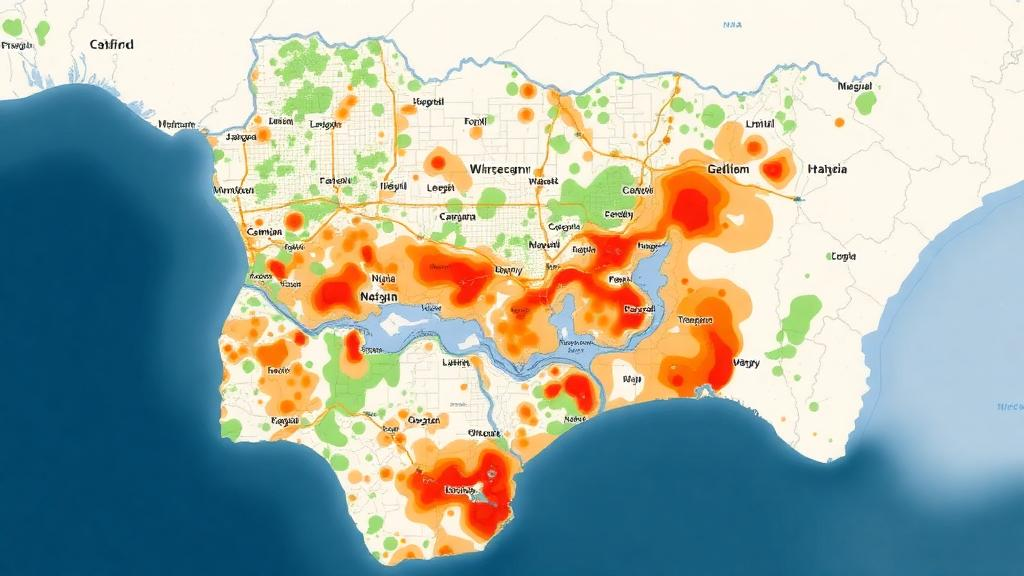
Flooding has become one of the most relentless natural hazards on the planet, and few places illustrate the crisis more starkly than Ilorin, the rapidly growing capital of Kwara State in north-central Nigeria. A new study published in Discover Cities has produced the most comprehensive flood susceptibility map yet for the metropolis, combining satellite imagery, digital elevation data, and a structured decision-making technique known as the analytical hierarchy process. The verdict is sobering: 42.8 percent of the city’s land area falls into the high or very high flood susceptibility categories, with the danger concentrated along the Asa River corridor and in low-lying neighborhoods that have expanded faster than the drainage infrastructure meant to protect them.
The research team, led by Olaitan Isioye and Muhammad Lawal Abubakar of Kaduna State University together with colleagues from Umaru Musa Yar’adua University and Federal University of Kashere, set out to overcome a persistent weakness in earlier flood studies of Ilorin. Previous analyses had largely confined themselves to the riparian corridor of the Asa River, leaving peri-urban and interior neighborhoods out of the picture even though unplanned expansion and poor drainage put them at risk too. The new assessment covers the entire metropolis, a landmass of roughly 951 square kilometers, and backs its predictions with an independently collected validation dataset of 200 flood and non-flood reference points gathered specifically for the study.
At the technical heart of the work lies a carefully assembled stack of geospatial data. The researchers drew on the ASTER Global Digital Elevation Model to characterize the terrain and on Landsat 8 OLI/TIRS imagery acquired in January 2024, an image with only 1.63 percent cloud cover, to capture the land surface. From these sources they derived nine flood-conditioning factors: elevation, slope, drainage density, the topographic wetness index, the stream power index, distance from streams, distance from roads, land use and land cover, and the normalized difference vegetation index. Each factor captures a different piece of the flood puzzle, from the gravitational pull of water across steep gradients to the erosive energy of concentrated runoff and the capacity of vegetation to intercept rainfall.
The land cover layer proved especially consequential. Using an object-based image analysis procedure in eCognition, the team classified the city into five categories through rule-based decision thresholds on two spectral indices. The normalized difference vegetation index, calculated from the near-infrared and red bands, separated vegetated and cultivated surfaces from sparser ground, while the modified normalized difference water index distinguished water bodies from built-up surfaces among the low-vegetation pixels. The resulting map showed built-up areas covering 25.4 percent of the metropolis, agricultural land 48.8 percent, bare surfaces 22.4 percent, vegetation just 3.1 percent, and open water a mere 0.3 percent. An independent check against 40 reference points yielded an overall classification accuracy of 92.5 percent and a Cohen’s kappa of 0.905, indicating strong agreement between the classified map and ground reality.
To weigh these nine factors against one another, the researchers turned to the analytical hierarchy process, a multicriteria decision-making method developed by Thomas Saaty that uses pairwise comparisons on a scale from one to nine. Land use and land cover emerged as the single most influential factor, receiving the highest weight of 0.216, a reflection of how the conversion of permeable ground to asphalt and concrete slashes infiltration and accelerates runoff. Elevation followed at 0.190 and slope at 0.138, consistent with their well-established control over flow accumulation and inundation depth. Drainage density, the topographic wetness index, and distance from streams received intermediate weights, while the stream power index, distance from roads, and the vegetation index carried lower values, with NDVI assigned the smallest weight of 0.038 because its influence is largely captured already within the land cover classification. A consistency ratio of 0.008, well below the accepted threshold of 0.10, confirmed that the expert judgments underpinning the weights were internally coherent.
Each continuous factor was reclassified into five susceptibility ranks using the Jenks natural breaks method, which minimizes variance within classes and maximizes separation between them, ensuring the thresholds were data-driven rather than arbitrary. The weighted overlay then combined everything into a single flood susceptibility index, the sum of each factor’s weight multiplied by its reclassified score. The spatial pattern that emerged is strikingly coherent. The highest-risk zones trace the course of the Asa River, which enters the metropolis from the northeast and exits to the southwest, flanked by low-lying terrain where the topographic wetness index reaches its maximum values and where the stream power index flags concentrated, high-energy runoff. Areas within 630 meters of streams were rated very highly susceptible, with risk declining progressively out to distances beyond 2.6 kilometers.
The final map classifies 0.8 percent of the study area as very low susceptibility, 9.3 percent as low, 47.1 percent as moderate, 30.8 percent as high, and 12.0 percent as very high. In practical terms, nearly three out of every ten square meters of Ilorin sits in the high category and one in eight in the very high category, meaning that a season of prolonged, intense rainfall would be expected to hit those zones hardest. The analysis also found that 37 percent of the city lies in low to very low elevation brackets, terrain that naturally collects water, while the gentlest slopes coincide with the Asa River and its tributaries, the Aluko, Alalubosa, Okun, Osere, Agba, and Atileke, all regulated by three dams. The findings echo earlier work in Kaduna, where a comparable GIS-AHP framework placed 25.8 percent of the city in high susceptibility zones.
What sets this study apart is the rigor of its validation. The team compiled 200 reference points: 60 locations flooded during the 2024 events in Ilorin and 140 non-flooded sites identified from historical records held by the Kwara State Emergency Management Agency, with coordinates independently collected in the field using a handheld Garmin GPS device. Comparing the map’s binary predictions, where high and very high classes counted as flood and the rest as non-flood, against these observations produced 60 true positives, 133 true negatives, 7 false positives, and zero false negatives. That translates into an overall accuracy of 96.5 percent, a sensitivity of 1.00, a specificity of 0.95, a precision of 0.895, a Cohen’s kappa of 0.919, and a root mean square error of just 0.187. The perfect sensitivity is particularly meaningful in hazard science, because a model that misses an actual flood location can cost lives, whereas the seven false positives represent a conservative tendency to overpredict risk at a handful of safe sites.
The authors are candid about the limitations. Rainfall and soil characteristics were excluded because spatially distributed datasets of sufficient resolution and quality were unavailable for the study period, an omission that introduces uncertainty since variations in rainfall intensity and soil infiltration strongly shape runoff generation. The land cover layer also rests on a single January 2024 satellite image, a snapshot rather than a record of change, even as settlement expansion continues in floodplain-adjacent districts. Future work, they suggest, should incorporate high-resolution rainfall and soil data, multitemporal land use analysis, and data-driven or hybrid modeling approaches to sharpen the picture further.
Even so, the implications for planning are immediate. The study recommends restricting or strictly regulating settlement expansion along floodplains, protecting the riparian wetlands that provide natural flood regulation services, and developing early warning systems to reduce the human toll of future events. Because the framework is reproducible and relies on freely available satellite data, the researchers argue it can be readily transferred to other rapidly urbanizing Nigerian cities where detailed hydrological observations are scarce. For a country where floods have repeatedly driven mass displacement, destroyed agriculture, and spread waterborne disease, and where global flood events have climbed from an average of 163 per year in the two decades to 2001 through 2020 to 223 in 2021 alone, a validated, city-wide map of where the water will go may prove to be one of the cheapest pieces of flood defenses Ilorin ever acquires.
Subject of Research: Flood susceptibility mapping in Ilorin Metropolis, Nigeria, using GIS, remote sensing, and the analytical hierarchy process
Article Title: Flood susceptibility assessment using GIS and an analytical hierarchy process in Ilorin Metropolis, Kwara, Nigeria
Article References: Isioye, O., Zailani, M. M., Hassan, M., Gaya, I. F., & Abubakar, M. L. (2026). Flood susceptibility assessment using GIS and an analytical hierarchy process in Ilorin Metropolis, Kwara, Nigeria. Discover Cities, 3(1), Article 197. https://doi.org/10.1007/s44327-026-00380-3
Image Credits: AI Generated
DOI: 10.1007/s44327-026-00380-3
Keywords: flood susceptibility, GIS, analytical hierarchy process, remote sensing, Ilorin, Nigeria, Asa River, land use land cover, digital elevation model, urban flooding, Landsat 8, disaster risk mapping
Cite Scienmag News
Violet Maxwell. (October 5, 2026). Satellite Maps Reveal Nearly Half of Nigerian City Faces High Flood Risk. Scienmag. https://scienmag.com/satellite-maps-reveal-nearly-half-of-nigerian-city-faces-high-flood-risk/
Violet Maxwell. "Satellite Maps Reveal Nearly Half of Nigerian City Faces High Flood Risk." Scienmag, 5 October 2026, https://scienmag.com/satellite-maps-reveal-nearly-half-of-nigerian-city-faces-high-flood-risk/. Accessed 5 October 2026.
Violet Maxwell. "Satellite Maps Reveal Nearly Half of Nigerian City Faces High Flood Risk." Scienmag. October 5, 2026. https://scienmag.com/satellite-maps-reveal-nearly-half-of-nigerian-city-faces-high-flood-risk/


