


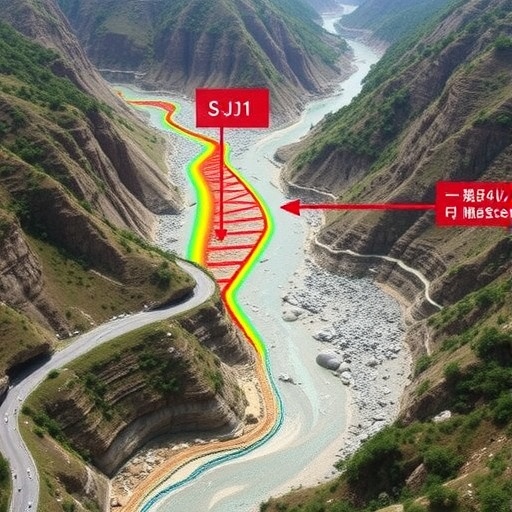
Deep in the lower reaches of China’s Jinsha River, on the bank of a reservoir whose water level swings by as much as 60 meters every year, a mountainside is quietly on the move. Scientists now have the most detailed picture yet of what is happening beneath the surface of the so-called S-J1 deformation body, a slowly creeping mass of soil and fractured rock near the world’s second-largest hydropower project. By combining millimeter-precision satellite navigation monitoring, borehole inclinometers, geological mapping, and limit equilibrium stability modeling, researchers have traced the anatomy of a potential landslide in unprecedented detail, revealing a buried slip surface lying between 22 and 34 meters below ground and identifying the hydrological conditions under which the slope could fail catastrophically.
The research, published in the journal Environmental Earth Sciences, centers on a slope in Qiaojia County, Yunnan Province, where rapid surface deformation in December 2024 fractured National Highway G248 and alarmed local communities. The study area sits within the shadow of a 289-meter-high arch dam, one of the tallest ever built, and on a reservoir where annual water-level fluctuations far exceed those of the better-known Three Gorges Reservoir, which typically sees swings of about 30 meters. That enormous range of rising and falling water creates a vast saturation and drainage zone along the reservoir banks, repeatedly soaking and then draining the soils that hold the slopes together. Engineers have long recognized that such cycling is among the most dangerous triggers for landslides in hydropower reservoirs worldwide, but the sheer scale of the fluctuation here makes bank stability an exceptionally acute problem.
The monitoring campaign itself is a technical achievement. Since February 2023, a network of seven GNSS receivers, certified for use with China’s Beidou system, has tracked the three-dimensional displacement of the slope, anchored by a reference station on the opposite bank. Using differential processing, the instruments achieve horizontal accuracy of plus or minus 2.5 millimeters and vertical accuracy of plus or minus 5 millimeters, allowing researchers to detect movements far too small for the human eye. The monitoring points span more than 200 meters of elevation, from about 871 meters to 1070 meters above sea level, arranged along a central cross-section running through the heart of the deforming zone. The data show that the slope is deforming continuously, though slowly, with horizontal displacement rates at the most active points in the range of 0.06 to 0.12 millimeters per day.
One of the most revealing findings concerns the direction of movement. At several points inside the deformation zone, notably TPdsg01 and TPdsg02, the three-dimensional displacement increments, 1.75 millimeters and 0.97 millimeters respectively, were far larger than the purely horizontal increments of 0.45 and 0.05 millimeters. This means the deformation in the rear portion of the slope is dominated by vertical subsidence rather than lateral sliding. The pattern is consistent with tensile cracks observed at the rear edge of the slope and supports an interpretation of retrogressive failure, in which the loss of support at the slope’s toe propagates backward, pulling the upper slope apart. Outside the deforming zone, some points recorded slightly negative three-dimensional changes, underscoring that the movement is spatially concentrated within the fractured mass.
To determine how deep the movement extends, the team installed five inclinometer boreholes along the same central cross-section. Inclinometers measure lateral displacement as a function of depth, and when a subsurface shear zone is active, the displacement-depth curves show a sharp deflection at the depth of shearing. The results were unambiguous: clear shear signatures appeared at approximately 22 meters in hole INzk102, 27 meters in INzk103, 34 meters in INzk104, and 23 meters in INzk105. The deepest zone, at 34 meters near the middle of the deformation body, likely corresponds to the thickest accumulated material or the principal slip zone. Rather than assuming an arbitrary failure geometry, the researchers used these four measured depths to construct a piecewise-linear, non-circular sliding surface for their stability model, grounding the calculation directly in physical measurement.
Field mapping by UAV survey and on-foot inspection catalogued 65 surface cracks whose spatial arrangement reads like a textbook landslide signature: extension at the rear, shearing along the flanks, and compression at the front. The arcuate main rear boundary crack, L1, opens up to 50 centimeters wide and shows vertical offsets of 2 to 3 meters. The left flank contains six shear cracks with up to 1.6 meters of downward displacement, while the densely fractured right flank carries 23 cracks that have damaged slope-protection structures such as lattice beams. At the front edge, intense thrusting has buckled the pavement of National Highway G248 by as much as 2.5 meters, accompanied by longitudinal extensional and transverse compressive fissures. The overall fractured zone spans elevations from about 930 to 1130 meters, stretches roughly 560 meters downslope, and would total around 5 million cubic meters if treated as a single mass, though the potentially mobile sliding mass identified by the inclinometer data is far smaller, about 440,000 cubic meters.
The formation mechanism, as reconstructed by the team, unfolds in stages. When the reservoir was first impounded, soils below the water level became saturated and lost strength, producing localized bank collapse near the 838-meter elevation contour and robbing the slope of frontal support. A weak layer of silty gravel in the middle and lower portion of the deposit, whose strength drops sharply as water content rises, then became the locus of shearing. As the reservoir level subsequently dropped, water draining out of the slope slower than the reservoir fell generated internal seepage pressures that pushed the mass downslope. Progressive connection of cracks eventually assembled the chair-shaped deformation body visible today. In short, impoundment was the initial trigger, but drawdown-induced seepage is the engine driving the ongoing, progressive deformation.
The quantitative stability analysis used the Morgenstern-Price limit equilibrium method, a standard approach that satisfies both force and moment equilibrium and is recommended under the Chinese industry standard DL/T 5353-2006 for non-circular slip surfaces. The sliding mass was discretized into 35 vertical slices, and calculations were performed under five loading scenarios: natural self-weight, rainfall infiltration with an assumed 5-meter saturation depth, impoundment at the normal water level of 825 meters, rapid drawdown from 820 to 805 meters, and seismic shaking represented with the pseudo-static method using a design horizontal acceleration of 0.05 g. The results paint a sobering picture. Before impoundment, factors of safety hovered around 1.16 to 1.18 under natural conditions. After impoundment, the overall slope dropped to a factor of safety of 1.060 under natural conditions and 1.055 under rainfall, indicating only marginal stability, while the deformation body itself fell to 1.048 and 1.042, classifying it as poorly stable.
Most alarming are the transient scenarios. Under seismic loading, the factor of safety of the deformation body plunges to 0.909, and that of the overall slope to 0.935, both below the critical threshold of 1.0, indicating outright instability. Under rapid drawdown, the factor of safety of the deformation body falls to 0.995, again signaling failure potential. These figures align neatly with the field record: cracking accelerated during drawdown periods, GNSS vectors show active creep at rates consistent with factors of safety just above unity, and the dominance of vertical settlement matches the tensile fissuring at the rear edge. The three independent lines of evidence, monitored displacement, measured slip geometry, and calculated stability, converge on the same conclusion, which gives the assessment unusual robustness for a single-slope study.
The consequences of failure would not stop at the slope itself. If the 440,000-cubic-meter sliding mass broke loose, the rear slope would lose its frontal support and could continue to retrogress, threatening the G248 national highway and potentially triggering renewed deformation of the slope behind it. Because roughly 120,000 cubic meters of the mass sits above the normal water level of 825 meters, and the granular material would tend to disintegrate on entry into the water, the researchers offer a preliminary qualitative judgment that any impulse wave hazard to the opposite resettlement bank, which lies above 860 meters, would be limited, though they emphasize that a quantitative surge analysis has not yet been performed.
In response, engineers have implemented an emergency mitigation scheme built on three principles: unload, drain, and seal. All accumulated material above the 1053-meter elevation is being excavated to remove the primary driving load, with benches every 10 meters of vertical rise and slope ratios tuned section by section, gentler at 1:3.0 in the sensitive rear zone and steeper at 1:1.5 where conditions allow. A systematic network of drainage ditches along the benches and interception ditches around the slope crest diverts runoff into natural gullies, preventing infiltration from softening the slip surface. Cracks that fall outside the excavation footprint, particularly those behind the 1060-meter platform, are being filled and compacted with low-permeability clay to block direct rainfall ingress. Longer-term recommendations include anchor cable reinforcement and a permanent real-time monitoring and early warning system.
The authors acknowledge the limits of their analysis, noting that the stability calculations use a saturated soil mechanics framework with a piezometric line approach rather than a transient unsaturated-saturated seepage analysis, a simplification they argue is acceptable because the most critical conditions, rapid drawdown and heavy rainfall, correspond to near-saturated states. They also stress that limit equilibrium yields factors of safety but does not simulate deformation processes directly, so their conclusions about progressive, retrogressive failure rest on the combined field evidence rather than the calculations alone. Even so, the study delivers something rare: continuous GNSS data spanning both the pre-failure and active deformation stages of a large reservoir landslide, coupled with directly measured slip-surface geometry. As hydropower development pushes into steep, tectonically active river valleys across Asia and beyond, the integrated monitoring-characterization-modeling paradigm demonstrated here offers a replicable template for identifying which reservoir banks are quietly creeping toward failure, and for intervening before the mountain moves too fast.
Cite Scienmag News
Violet Maxwell. (September 10, 2026). Tracking S-J1 landslide deformation along the lower Jinsha River with GNSS. Scienmag. https://scienmag.com/tracking-s-j1-landslide-deformation-along-the-lower-jinsha-river-with-gnss/
Violet Maxwell. "Tracking S-J1 landslide deformation along the lower Jinsha River with GNSS." Scienmag, 10 September 2026, https://scienmag.com/tracking-s-j1-landslide-deformation-along-the-lower-jinsha-river-with-gnss/. Accessed 10 September 2026.
Violet Maxwell. "Tracking S-J1 landslide deformation along the lower Jinsha River with GNSS." Scienmag. September 10, 2026. https://scienmag.com/tracking-s-j1-landslide-deformation-along-the-lower-jinsha-river-with-gnss/


