


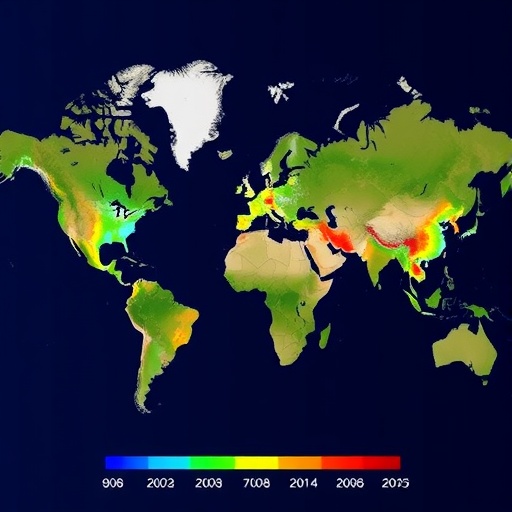
When people search Google for information about heat waves and floods, they tend to do so in the very years when those hazards peak, according to a new global study that matches two decades of satellite-derived hydroclimate data with online search behavior across more than 240 countries and territories. The research, published in Environmental Earth Sciences by Dmitry Erokhin and Nadejda Komendantova of the International Institute for Applied Systems Analysis in Austria, constructs an unusually ambitious panel linking NASA POWER meteorological observations to Google Trends topic interest for every year from 2004 to 2025, and then asks a deceptively simple question: when does physical water risk become socially visible?
The answer, the authors find, is only modestly and unevenly. Heat-related water stress shows the strongest contemporaneous association with search interest of the six risk domains examined, with a pooled Pearson correlation of 0.145, followed by flood and extreme rainfall at 0.101. Those numbers are statistically detectable in a panel of more than 32,000 country-risk-year rows, but they are small, and even the statistically significant relationships explain very little of the year-to-year variation in search behavior within countries. Drought, climatic water deficit, hydroclimatic volatility, and an overall composite water-risk index all produced correlations statistically indistinguishable from zero at the global scale. The pattern suggests that hazards people can see and feel in the moment—scorching heat, inundated streets—drive online information seeking far more reliably than slow-onset crises such as drought, which accumulate through reservoir levels, crop failures, and rationing announcements rather than through a single dramatic signal.
The study’s architecture is as noteworthy as its headline findings. The researchers extracted monthly meteorological data from the NASA POWER API for a single geographic centroid in each of 244 countries and territories, spanning from 75.25 degrees south—including the Antarctic centroid—to 77.55 degrees north. From these point observations they built six screening indices: drought, flood and extreme rainfall, water deficit, heat-related water stress, hydroclimatic volatility, and an overall water-risk score. The construction relies on physically interpretable building blocks. Potential evapotranspiration, the atmosphere’s evaporative demand, was estimated with a Hargreaves-style temperature formulation that combines monthly mean, maximum, and minimum temperatures with extraterrestrial radiation. Climatic water deficit was defined as annual potential evapotranspiration minus annual precipitation, so that positive values indicate demand outstripping supply. The precipitation concentration index captured whether a country’s rainfall arrived concentrated in a few months rather than spread across the year. Threshold indicators flagged dry months below the country’s own lower precipitation quartile, wet months above the upper quartile, and hot months exceeding the 90th percentile of monthly maximum temperature—cutoffs chosen relative to each country’s own history rather than any universal standard.
Each annual indicator was then standardized within country as a z-score, expressing how unusual a given year was compared with that nation’s own 2004–2025 baseline, and the standardized components were averaged into the domain indices and rescaled to a 0-to-100 range for presentation. The authors are candid about the cost of this harmonization. A country centroid compresses enormous internal climate gradients in large nations, archipelagos, and mountain systems, and the resulting indices describe conditions at sampled points rather than national hydrological inventories. They omit soil moisture, streamflow, groundwater, snowpack, reservoir storage, and exposure entirely. Diagnostics confirmed substantial overlap among the domains: drought and water deficit correlated at r = 0.912 because both contain climatic water deficit, and the overall index is mechanically tied to all five components. Weight-sensitivity tests using 1,000 random weight draws showed that rankings were most stable for drought and heat stress and least stable for volatility, reinforcing that the six measures should be read as overlapping hazard framings rather than independent constructs.
On the attention side, the team paired each risk domain with a single Google Trends conceptual topic—platform-defined categories that absorb spelling variants, translations, and related terms—rather than combining individually queried search terms, which Google normalizes in ways that resist aggregation. Country-level interest scores were adjusted by the global interest-over-time series for the same topic and year, so that a regional score carries less weight in years when the topic is globally quiet. The authors stress that the resulting measure is neither an absolute search count nor a conventional 0-to-100 Trends series. A zero value can reflect low search volume, platform thresholds, limited internet access, or language mismatch, and cannot be taken as evidence that people in a country are unconcerned. Throughout the paper, the measure is interpreted strictly as observed search salience within a specific platform and topic frame.
To test whether search activity anticipates or trails physical anomalies, the researchers computed lead-lag correlations from three years before to three years after each risk year, repeating the exercise in first differences to strip out persistent country-level trends. The verdict was sobering. Heat and flood domains peaked at lag zero, consistent with attention occurring in the same year as the hazard, but first differencing reduced even those coefficients—from 0.145 to 0.099 for heat and 0.101 to 0.081 for flood—and no domain displayed a stable progression across adjacent lags. The authors conclude that the annual data offer no dependable mechanism by which search interest could serve as an early-warning signal or a delayed-response indicator, and they explicitly rule out operational applications built on this panel.
Country-level analysis revealed enormous heterogeneity but equally enormous statistical fragility. Of 1,452 theoretical country-domain combinations, 1,033 yielded estimable correlations, and these ranged widely—mean country-level correlations were highest for heat and water stress at 0.233. Yet of the more than a thousand coefficients, only 31 survived a global false-discovery-rate correction based on conventional sample sizes, and none survived once the authors replaced nominal sample sizes with an effective sample size adjusted for serial autocorrelation in the short annual series. A seemingly impressive correlation of 0.821, the paper notes, is estimated from roughly 22 observations and is one of over a thousand simultaneous tests. The resulting maps therefore present country coefficients as exploratory signals rather than confirmed national effects—a methodological discipline the authors argue is often missing from studies that mine digital trace data.
Perhaps the most practically useful output is the systematic identification of convergent and divergent country-years. Convergent cases combine upper-decile physical risk with upper-decile search salience, pinpointing where environmental and informational signals align. Divergence runs both ways: high-risk years in which the corresponding search topic was not detected at all, and low-risk years in which search salience spiked without any extreme value in the physical indicator. The authors do not speculate about mechanisms in individual cases—local terminology, alternative search platforms, news coverage, government warnings, political controversy, digital access, or impacts omitted from the meteorological inputs could all explain a mismatch—but they argue that making these gaps observable provides a transparent, defensible basis for selecting cases for deeper, local investigation rather than for drawing conclusions from the global screen alone.
The temporal descriptive statistics carry their own signals. Global mean heat and water stress rose from 41.36 in 2011 to 59.52 in 2024, and flood and extreme rainfall climbed from 35.71 in 2013 to 43.98 in 2020, consistent with an intensifying global water cycle. On the attention side, interest in flood and extreme rain peaked in 2024, while drought searches crested in 2022. A completeness audit confirmed that all 244 physical entities had twelve monthly NASA observations for 2025 and that the extraction, performed in May 2026, captured full annual records, so the latest year is not a partial snapshot; excluding 2025 changed pooled coefficients by at most 0.012, leaving the substantive ordering intact.
The authors frame their contribution as methodological and diagnostic rather than operational. By placing several hydroclimatic anomaly framings and a platform-based attention measure inside a single reproducible country-year framework—complete with dependence checks, two-way fixed-effects models with country-clustered standard errors, temporal differencing, and hierarchical multiplicity control—the study demonstrates how easily large raw coefficients can overstate the evidence, and how much inferential care is required before digital traces can inform socio-hydrological research. The work was funded by the European Union’s HORIZON SystR Project under grant number 101212761, and the reproducibility package is archived openly on Zenodo.
For risk communicators and water managers, the takeaway is a staged, cautious one. Physical monitoring remains the basis for identifying anomalies; search data can indicate whether a hazard has become socially visible within a particular platform and normalization frame. Used together, they can flag cases in which the two signals align or disconnect, prompting analysts to check whether a pattern persists when topics are expressed in local languages or compared against subnational meteorology, disaster-impact records, official warnings, and news coverage. Where the divergence dissolves under locally appropriate evidence, the original global signal should be discarded. The central question, the authors conclude, is not whether Google Trends measures water risk—it demonstrably does not, at least not at annual and national resolution—but whether a divergence between physical conditions and public information seeking points to a communication or measurement process worth investigating with richer local data. In an era of intensifying floods, heat, and drought, knowing where hazards fail to register in public attention may prove as consequential as measuring the hazards themselves.
Cite Scienmag News
Violet Maxwell. (September 8, 2026). Google water searches track NASA hydroclimate risk signals across countries, 2004–2025. Scienmag. https://scienmag.com/google-water-searches-track-nasa-hydroclimate-risk-signals-across-countries-2004-2025/
Violet Maxwell. "Google water searches track NASA hydroclimate risk signals across countries, 2004–2025." Scienmag, 8 September 2026, https://scienmag.com/google-water-searches-track-nasa-hydroclimate-risk-signals-across-countries-2004-2025/. Accessed 8 September 2026.
Violet Maxwell. "Google water searches track NASA hydroclimate risk signals across countries, 2004–2025." Scienmag. September 8, 2026. https://scienmag.com/google-water-searches-track-nasa-hydroclimate-risk-signals-across-countries-2004-2025/


