


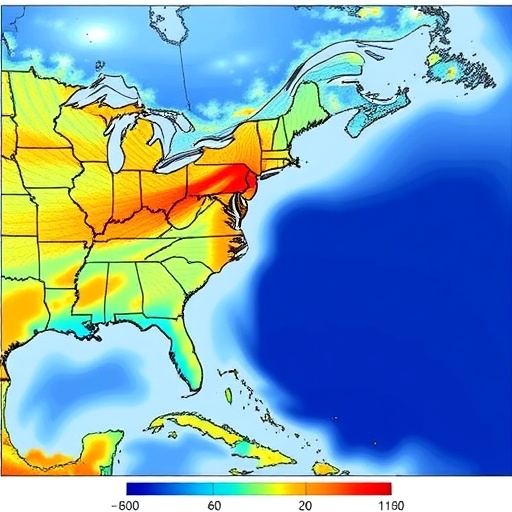
When waves break along a shoreline, they do more than throw spray into the air. They physically push the ocean’s surface upward, raising the mean water level at the coast in a phenomenon scientists call wave setup. This effect has long been recognized as a contributor to storm-driven coastal flooding, but its role in the slower, long-term rhythm of coastal sea level has remained largely invisible. Now, a decade-long modeling study has delivered the first dynamic, regional-scale climatology of wave setup along the U.S. East and Gulf of Mexico coasts, revealing patterns of seasonal variation, interannual fluctuation, and spatial coherence that could reshape how coastal flood risk is assessed.
The research, conducted by ASM Alauddin Al Azad and Reza Marsooli of Stevens Institute of Technology and published in the journal Ocean Dynamics, tackles a persistent blind spot in coastal oceanography. Satellite radar altimeters measure offshore sea surface height and wave height, but not the nearshore water-level rise caused by breaking waves. Tide gauges, some with records stretching back centuries, are typically housed in sheltered harbors where wave influence is minimal. Field campaigns with buried pressure sensors can capture wave setup directly, but only for days to weeks before currents, sediment transport, and wave energy destroy the instruments or interrupt the data. As a result, most existing estimates of long-term wave setup have relied on empirical formulas that depend on beach slope, deep-water wave energy flux, and limited field measurements — assumptions that can introduce substantial error when applied across diverse coastlines.
To move beyond these constraints, the team turned to dynamical modeling using a fully coupled hydrodynamic-wave system. The hydrodynamic component, ADCIRC, solves the depth-averaged barotropic shallow water equations to simulate tides and storm surges, while the spectral wave model SWAN solves the depth-integrated wave-action balance, incorporating wind input, whitecapping, bottom friction, nonlinear wave-wave interactions, and depth-limited breaking. On a shared unstructured mesh, the two models exchange information at every time step: ADCIRC passes water levels and currents to SWAN, which uses them to account for wave-current interaction and wave transformation through refraction, shoaling, and dissipation. SWAN then computes wave radiation stresses — the momentum flux transferred from breaking waves to the water column — and feeds the gradients of those stresses back into ADCIRC’s momentum equations. This two-way coupling allows wave-induced forcing on coastal water levels to emerge explicitly from the physics rather than from a formula.
The computational demands were considerable. The model domain covers the western North Atlantic between 6°N and 46°N and 98°W to 53°W, discretized into a mesh of more than 1.7 million nodes and 3.4 million triangular elements, with coastal resolution of 500 meters to 1 kilometer in waters shallower than 300 meters. SWAN’s spectral domain contained 36 directional bins and 31 frequencies spanning 0.04 to 0.667 hertz. Both models were forced with hourly surface pressure and 10-meter wind fields from the ERA5 reanalysis, along with open-ocean boundary water levels and direction-frequency wave spectra that account for swells generated far outside the domain. The team’s earlier validation work showed that the ST6 source-term package for wave physics gave the best agreement with National Data Buoy Center observations along both coasts. A single 31-day coupled simulation required roughly 26 hours on two compute nodes of Purdue University’s Anvil system, each carrying 128 AMD EPYC cores.
The core analytical trick was elegant in its simplicity: the researchers ran two parallel sets of decade-long simulations from 2006 to 2015, one with the full coupled system and one with stand-alone ADCIRC that excluded wave effects. At every coastal site and time step, wave setup was computed as the difference in simulated water level between the two runs, isolating the wave contribution under identical tidal and meteorological conditions. Thirty-two representative sites were selected where nearshore bathymetry is gently sloping, ensuring that the surf zone is wide enough to be resolved by at least two mesh nodes and that radiation stress gradients decrease smoothly toward shore. Steep, heterogeneous regions such as the Gulf of Maine — with its bedrock-framed, glaciated shelf — were deliberately excluded, because accurately capturing wave setup there would require ultra-high-resolution models that are computationally prohibitive at regional scale.
The results paint a clear picture of asymmetry between the two coasts. Wave setup along the U.S. East Coast is consistently larger than along the Gulf of Mexico, reflecting the Atlantic’s exposure to open-ocean fetch, frequent intense storms, and long-period swells. Across the Northeast and Mid-Atlantic sites, mean wave setup ranged from 0.8 to 1.47 centimeters, with extremes — defined as the 99th percentile — between 5.0 and 8.2 centimeters. The single largest extreme value, 8.19 centimeters, occurred near Virginia Beach, Virginia, a region exposed to some of the most energetic wave events on the eastern seaboard. The largest mean value, 1.7 centimeters, appeared in South Carolina. By contrast, Gulf Coast sites showed mean setups of just 0.2 to 1.0 centimeter and extremes of 1.5 to 4.7 centimeters. Averaged across all sites, Gulf Coast mean wave setup was only 44 percent of the East Coast average, and extreme wave setup just 48 percent — a gap rooted in the Gulf’s semi-enclosed geography and limited fetch, where large waves are almost entirely the product of hurricanes and winter cold fronts known as nortes.
Seasonality emerged as a dominant signal. Winter months, defined as October through March, produced substantially higher mean and extreme wave setup than summer months at every region analyzed. Along the Northeast Atlantic coast, winter mean wave setup averaged 1.4 centimeters against a summer average of 0.9 centimeters, a difference the authors attribute to the frequent passage of slow-moving extratropical cyclones — nor’easters — that batter the coast with northeast winds for days at a time. Month-by-month analysis showed that Atlantic sites peak in November, when late-season tropical cyclones overlap with the onset of the winter storm season, while Gulf sites peak slightly later, in December, consistent with the dominance of winter frontal systems. July registered the lowest values everywhere, reflecting mid-summer quiescence. Interestingly, along the Southeast Atlantic coast the seasonal gap in extreme values narrows considerably, because powerful swells generated by distant Atlantic hurricanes propagate toward the coast even in summer and elevate water levels far from any local storm.
Year-to-year variability told a similar story of Atlantic dominance. The interannual variability of annual mean wave setup was about 57 percent larger along the East Coast than the Gulf, and that of extreme values about 28 percent larger. Hotspots of variability aligned with physical geography: central Florida sites fronted by narrow continental shelves showed the highest fluctuations, because narrow shelves allow waves to retain energy until breaking close to shore, so small changes in incident wave energy translate into comparable changes in setup. Conversely, the broad, shallow shelves off Georgia and South Carolina dissipate incoming swells and shelter the coast behind a concave shoreline, damping variability to the lowest values recorded. The authors link the Atlantic’s interannual swings to large-scale climate drivers — the El Niño–Southern Oscillation, which modulates both Atlantic hurricane activity and mid-latitude storm tracks, and the Pacific North American pattern, which covaries with winter wave power along the western North Atlantic boundary. Along the Gulf, variability is governed mainly by hurricane landfalls, winter fronts, and coastally trapped Kelvin waves.
The spatial statistics added a further layer of insight. Monthly wave-setup anomalies were strongly correlated between nearby sites on both coasts — mean Pearson correlations of 0.69 and 0.76 within 75 kilometers along the East and Gulf coasts, respectively — but coherence decayed far more slowly along the Atlantic. A fitted spherical variogram yielded a decorrelation range of 642 kilometers for the East Coast against just 292 kilometers for the Gulf, indicating that the Atlantic coastline responds coherently to basin-scale storm systems and swells over vast stretches, while Gulf Coast behavior transitions quickly to locally differentiated patterns shaped by variable shelf width, bathymetry, and coastal orientation.
Trend analysis over the decade revealed a mixed and geographically patchy picture. East Coast sites showed both positive and negative trends, often with adjacent sites displaying opposite signs and no consistent north–south gradient; the largest positive trend, +0.30 millimeters per year, occurred at Virginia Beach, while a site in New York recorded −0.35 millimeters per year. The Southeast Atlantic trended predominantly upward, averaging +0.1 millimeters per year. The Gulf Coast, by contrast, was dominated by negative trends, with the steepest decline of −0.324 millimeters per year in the Florida Panhandle. Nearly all trends were statistically significant at the 95 percent confidence level, though the authors caution that a ten-year window is short, and the detected patterns may partly reflect internal climate oscillations rather than persistent, climate-driven change. The patterns do, however, mirror observed multidecadal trends in significant wave height at nearby buoys.
The practical implications extend beyond academic climatology. Wave setup is a spatially variable addition to coastal water levels that current sea-level assessments largely ignore, and even modest wave-induced increases can push high tides above flooding thresholds, sharply raising the frequency of minor high-tide flooding. Previous research has shown that wave setup contributed up to 17 percent of peak storm tides from historical tropical cyclones along these very coasts, and up to half of the 100-year surge on narrow-shelf segments. By identifying hotspot segments and quantifying the natural variability against which future changes must be judged, this study provides a dynamic baseline that could improve flood forecasting, sharpen sea-level rise projections, and ultimately prevent the systematic underestimation of coastal water levels in one of the world’s most densely developed shoreline regions.
Cite Scienmag News
Violet Maxwell. (September 8, 2026). Coupled hydrodynamic-wave model quantifies wave setup along U.S. East and Gulf coasts. Scienmag. https://scienmag.com/coupled-hydrodynamic-wave-model-quantifies-wave-setup-along-u-s-east-and-gulf-coasts/
Violet Maxwell. "Coupled hydrodynamic-wave model quantifies wave setup along U.S. East and Gulf coasts." Scienmag, 8 September 2026, https://scienmag.com/coupled-hydrodynamic-wave-model-quantifies-wave-setup-along-u-s-east-and-gulf-coasts/. Accessed 8 September 2026.
Violet Maxwell. "Coupled hydrodynamic-wave model quantifies wave setup along U.S. East and Gulf coasts." Scienmag. September 8, 2026. https://scienmag.com/coupled-hydrodynamic-wave-model-quantifies-wave-setup-along-u-s-east-and-gulf-coasts/


