


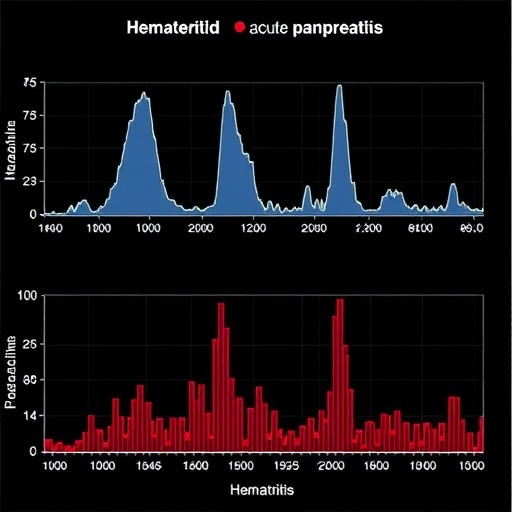
Two routinely measured blood tests, tracked not as isolated numbers but as evolving curves over the first week of intensive care, may fundamentally change how doctors manage one of the world’s most common gastrointestinal emergencies. In a large multicenter study published in the Journal of Advanced Research, researchers report that the combined trajectories of hematocrit (HCT) and blood urea nitrogen (BUN) in patients with acute pancreatitis split critically ill individuals into five distinct clinical subphenotypes, each carrying dramatically different risks of death, pancreatic necrosis, and organ failure. The work directly addresses an unresolved question posed by the 2024 American College of Gastroenterology guidelines: does frequent early monitoring of BUN and HCT actually help clinicians prevent severe disease and mortality?
Acute pancreatitis is a high-incidence gastrointestinal emergency worldwide, and its management has long been mired in controversy, particularly regarding early fluid therapy. International guidelines from the American College of Gastroenterology and the International Association of Pancreatology recommend early, aggressive fluid resuscitation and advocate dynamic monitoring of HCT and BUN, yet robust evidence about how these markers predict prognosis has been lacking. The problem is compounded by the fact that patients with acute pancreatitis are extremely heterogeneous. A one-size-fits-all fluid protocol can be dangerous in both directions: insufficient resuscitation can starve organs of perfusion and drive tissue necrosis, while excessive infusion is independently associated with fluid overload, pulmonary edema, abdominal compartment syndrome, persistent organ failure, and death.
The research team, led by Jianhua Wan and colleagues including senior author Liang Xia, drew on two independent cohorts. The development cohort came from the gastroenterology intensive care unit of the First Affiliated Hospital of Nanchang University in Jiangxi Province, China, comprising 2,027 patients after exclusions from an initial 2,919 admissions between January 2014 and December 2024. Validation was performed on 1,381 patients from two United States critical care databases, MIMIC-IV and eICU-CRD. All patients met the diagnostic criteria for acute pancreatitis under the Revised Atlanta Classification, were aged 18 or older, and had at least three HCT or BUN measurements within their first week in the ICU. Patients were excluded if they had pancreatitis during pregnancy, end-stage liver or kidney disease, or were not first ICU admissions.
The analytical core of the study was group-based multi-trajectory modeling, or GBMTM, a statistical technique that identifies subgroups of patients who follow similar longitudinal patterns. Both HCT and BUN trajectories were fitted with cubic polynomials using measurements taken on days 1, 2, 3, 5, and 7 after ICU admission, under the assumption that missing laboratory values occurred at random. Model selection was guided by the Bayesian Information Criterion and average posterior probability, with the optimal five-trajectory model showing posterior probabilities above 0.8 for every group and no group falling below five percent of the cohort distribution. The model was replicated consistently in the American validation cohort, strengthening confidence that the patterns are not artifacts of a single health system.
Five subphenotypes emerged. T1, the Renal Dysfunction subphenotype, was defined by persistently low HCT paired with persistently high BUN, a combination suggesting insufficient renal perfusion amid ongoing inflammation. T2, the Fluid-Responsive subphenotype, showed an initially high HCT that fell rapidly to normal along with persistently low BUN, indicating that fluid resuscitation was working effectively. T3, the Volume-Deficient subphenotype, displayed an initially high HCT that dropped quickly alongside moderately elevated BUN, signaling hemoconcentration with renal hypoperfusion. T4, the Stable subphenotype, kept both markers in normal ranges, while T5, the Hemodilution subphenotype, showed persistently low HCT with normal BUN, possibly reflecting underlying anemia or prior fluid overload.
The prognostic implications were stark. In the Chinese development cohort, mortality reached 36.6 percent in the T1 group, 20.9 percent in T3, and 11.5 percent in T5, compared with just 2.7 percent in the stable T4 group. After adjusting for age, body mass index, vital signs, laboratory values, fluid volumes, and the use of continuous renal replacement therapy, T1 remained independently associated with a 7.32-fold increase in the odds of in-hospital death, T3 with 4.75-fold, and T5 with 3.54-fold increases. In the American validation cohort the signal was even stronger, with T1 carrying an adjusted odds ratio of 16.27 for mortality. Kaplan-Meier survival analysis confirmed robust differences in survival probabilities across subphenotypes, and restricted cubic splines revealed a non-linear relationship between first-week HCT and BUN levels and mortality risk.
Perhaps the most striking finding came from a feature-importance analysis using the Boruta algorithm: the trajectory classification outperformed traditional predictors of mortality, including the widely used APACHE II severity score and creatinine levels. The trajectory model achieved an area under the receiver operating characteristic curve of 0.78, compared with 0.72 for admission BUN alone, 0.68 for APACHE II, and 0.68 for the BISAP score. Reclassification metrics, including net reclassification improvement and integrated discrimination improvement, confirmed that the dynamic classification added predictive value beyond static admission measurements. Decision curve analysis showed the highest net clinical benefit across a broad range of risk thresholds.
To make the system practical at the bedside, the team built a random forest classifier using fourteen variables available within 24 hours of admission: sex, age, hypertension, BMI, heart rate, mean arterial pressure, albumin, creatine kinase, triglycerides, glucose, creatinine, prothrombin time, BUN, and HCT. After feature selection via Lasso regression and five-fold cross-validation for hyperparameter tuning, the model achieved macro and micro average AUCs of 0.956 and 0.957 in training and 0.912 and 0.917 in internal testing. External validation on the American cohort yielded AUCs of 0.861 and 0.871, demonstrating meaningful generalization across health systems with different patient demographics, laboratory reference ranges, and practice patterns. The classifier has been deployed as a free web-based Shiny application that clinicians can use to predict a patient’s subphenotype early in the disease course.
The study’s implications for fluid therapy are equally consequential. Analysis of fluid intake volumes and mortality risk using generalized linear models and contour plots revealed that the “safe” fluid range differs sharply by subphenotype. Patients in the T1 renal dysfunction group had a narrow tolerance window, with a first-day fluid volume of 2,500 to 4,000 milliliters associated with the lowest mortality and volumes exceeding 4,000 milliliters significantly increasing the risk of death after covariate adjustment. In the T3 volume-deficient group, patients tolerated relatively high first-day volumes, with a safe range extending to 7,000 milliliters, yet required careful restriction on the second day to avoid escalating risk. Across all five groups, non-survivors received larger fluid volumes in the first three days than survivors, a pattern consistent with growing evidence that over-resuscitation harms patients regardless of baseline status.
These results challenge the conventional reflex to treat every patient with an elevated hematocrit as needing aggressive fluid boluses. In the T3 group, the hematocrit alone would suggest severe hemoconcentration and justify large infusions, but the BUN dynamics reveal a different picture of how much volume the patient’s kidneys can actually handle. Conversely, the T5 hemodilution group illustrates the danger of interpreting laboratory values in isolation: despite normal BUN, persistently low HCT was associated with significantly elevated mortality. The trajectory framework therefore offers clinicians a real-time decision scaffold, recommending conservative fluid strategies with close monitoring of pleural effusion and intra-abdominal pressure for high-risk T1 and T5 patients, and a carefully timed early resuscitation window for T3 patients.
The findings were robust across extensive sensitivity analyses, including alternative missing-data imputation methods, exclusion of patients with recurrent pancreatitis or diabetes, restriction to patients admitted within three days of symptom onset, and analyses confined to sicker patients with APACHE II scores of eight or higher. Subgroup analyses confirmed consistent associations across etiology, sex, age, and BMI strata. The authors caution, however, that as a retrospective observational study, unmeasured confounding cannot be fully excluded, that the total fluid intake recorded did not distinguish crystalloid from colloid or infusion rates, and that trajectory modeling requires relatively frequent laboratory monitoring. Randomized controlled trials will be needed to confirm whether subphenotype-guided fluid management genuinely outperforms standard care protocols. Even so, the study provides the first dynamic subphenotype classification system for the acute phase of pancreatitis built on two of the cheapest and most widely available laboratory tests in medicine, offering a hypothesis-generating framework for individualized fluid therapy precisely where international guidelines have admitted the evidence gap is widest.
Cite Scienmag News
Ophelia Keating. (September 4, 2026). Dynamic hematocrit and BUN trajectories identify acute pancreatitis subphenotypes in ICU. Scienmag. https://scienmag.com/dynamic-hematocrit-and-bun-trajectories-identify-acute-pancreatitis-subphenotypes-in-icu/
Ophelia Keating. "Dynamic hematocrit and BUN trajectories identify acute pancreatitis subphenotypes in ICU." Scienmag, 4 September 2026, https://scienmag.com/dynamic-hematocrit-and-bun-trajectories-identify-acute-pancreatitis-subphenotypes-in-icu/. Accessed 4 September 2026.
Ophelia Keating. "Dynamic hematocrit and BUN trajectories identify acute pancreatitis subphenotypes in ICU." Scienmag. September 4, 2026. https://scienmag.com/dynamic-hematocrit-and-bun-trajectories-identify-acute-pancreatitis-subphenotypes-in-icu/


