


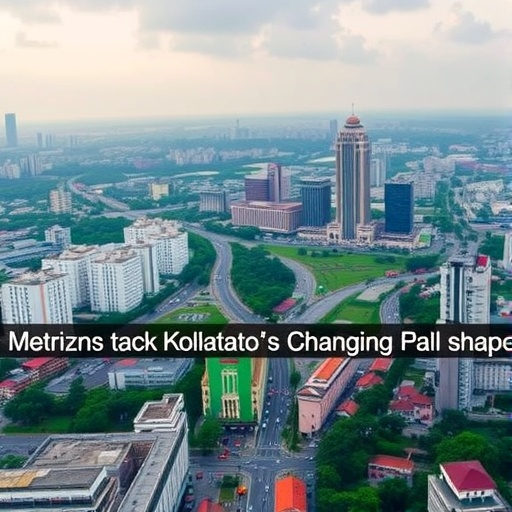
Kolkata, one of India’s oldest and most densely populated metropolitan regions, is on a trajectory to become nearly two-thirds urban by 2070, according to a new study that has combined five decades of satellite imagery with machine learning and cellular automata modelling to reconstruct, in remarkable detail, how the city and its surroundings have consumed the landscape—and how they will continue to do so. The research, published in the journal Discover Cities, documents a dramatic transformation in the Kolkata Metropolitan Area (KMA), where built-up land accounted for less than 5% of the territory in 1975 but had already surged to nearly half of the total land area by 2025. The projections, if current trends persist, point toward an urban share of 67% by 2070, with vegetation bearing the brunt of the loss and the internationally significant wetlands of southeastern Kolkata under continued pressure.
The study, led by Abhisek Santra of Adamas University together with Shreyashi S. Mitra of Techno India University, Akhilesh Kumar of the University of New South Wales, and Shidharth Routh of Haldia Institute of Technology, set out to answer questions that earlier work on Kolkata had left unresolved: how urban expansion has maintained its dynamics over the last fifty years, and what the micro-level spatial character of future growth will look like. Rather than treating the metropolis as a single undifferentiated unit, the researchers divided the KMA into eight cardinal directions and ten concentric buffer zones at 5-kilometre intervals, producing an unusually fine-grained picture of where fragmentation, consolidation, and sprawl are unfolding. The metropolitan area, which spans roughly 1,887 square kilometres across four districts of West Bengal and houses nearly 14 million people, comprises four municipal corporations—Kolkata, Howrah, Bidhannagar, and Chandannagar—and 37 municipalities.
The analytical backbone of the study is a time series of Landsat imagery stretching from 1975 to 2025. Landsat MSS data provided the earliest baseline, while the team relied on the Thematic Mapper sensors of Landsat 4–5 for the period from 1980 to 2005, Enhanced Thematic Mapper Plus imagery for 2010, and the Operational Land Imager instruments aboard Landsat 8 and 9 for 2015 through 2025. All images were co-registered to the WGS 84-based UTM Zone 45 coordinate system and radiometrically corrected using the ATCOR 2 module, which is based on the MODTRAN 4 radiative transfer code. From these images, the researchers generated land use and land cover maps classifying the landscape into five categories: built-up, vegetation, agriculture, water, and barren land. Classification was performed with a machine learning Support Vector Machine classifier, and accuracy was assessed using 500 systematically random reference points allocated through an area-stratified sampling design. Producer and user accuracies both exceeded 0.9, with kappa values ranging from 0.893 in 1975 to 0.93 in 1995—figures the authors describe as satisfactory for the analyses that followed.
To project the future, the team turned to the Cellular Automata–Markov chain model, a framework that couples the temporal transition probabilities of the Markov process with the spatial neighbourhood rules of cellular automata. Crucially, the model was guided by sixteen driver variables—eleven factors and five constraints—selected for their influence on urban growth. The factors included elevation, slope, groundwater depth, and distances from the central business districts, schools, higher education institutions, hospitals, roads, railway stations, and existing built-up areas, grouped into physical and cultural or infrastructural drivers. The constraints, which restrict expansion, comprised distance from the main river, distance from wetlands, restricted areas, distance from railway lines, and existing water bodies. Each variable was tested for multicollinearity before entering the model; pairwise correlations never exceeded 0.5 and variance inflation factors stayed well below the conventional threshold of 3, ranging from 1.01 to 2.55 for factors and peaking at 1.68 for constraints. Fuzzy standardization and the Analytical Hierarchy Process were then used to weight and integrate the variables into a suitability surface, from which transition potential maps and ultimately predicted land use maps for 2030 through 2070 were produced.
Validation of the model was rigorous. A simulated 2025 map was compared against the classified 2025 map using three complementary diagnostics: the Figure of Merit, which measures the overlap between observed and predicted change; Quantity Disagreement, which captures errors in class proportions; and Allocation Disagreement, which captures errors in spatial placement. The model achieved a Figure of Merit of 81.58%, indicating strong overlap between predicted and actual built-up expansion, a very low Quantity Disagreement of just 0.35%, and an Allocation Disagreement of 7.14%, showing that nearly all residual error stemmed from misplaced pixels rather than wrong class totals. The authors caution, however, that the projections should be read as scenario-based representations of potential futures under current growth tendencies—not as deterministic forecasts, since the model cannot capture policy shifts, economic transitions, or climate-driven migration.
The numbers charting the historical transformation are stark. Urban land in the KMA grew from just over 89 square kilometres in 1975 to approximately 219 square kilometres by 1980—nearly a two-and-a-half-fold increase in five years. The expansion continued steadily: 21% of the total land area by 1990, 25% by 1995, 30% by 2000, 32% by 2005, 35% by 2010, 37% by 2015, 42% by 2020, and 48% by 2025. Projections suggest 54% by 2040, followed by 58%, 62%, and finally 67% by 2070. While agricultural land has remained comparatively resilient—declining from 45% in 1975 to 41.52% by 2020, and projected to fall to 24% by 2070—vegetation has collapsed far more rapidly. Green cover, which accounted for 40 to 45% of the landscape until 1980, dropped to 20% by 2000, 15% by 2010, and just over 10% by 2020, with the model anticipating a mere 4.08% remaining by 2070. Wetlands in the southeast of the metropolitan area, including the East Kolkata Wetlands, a Ramsar-listed conservation site, have been progressively fragmented and converted, a trend the authors single out as particularly alarming.
The spatial metrics analysis reveals a fascinating shift in the morphology of growth. Before 2015, urbanization in the KMA was dominated by fragmentation: new, isolated patches were proliferating across the landscape, pushing the number of patches ever upward. After 2015, the pattern inverted. Patch numbers began to decline while the Largest Patch Index, a measure of the dominance of the biggest contiguous urban patch, rose steadily—evidence that scattered developments are now merging into consolidated urban masses. The CLUMPY index, which ranges from -1 for complete disaggregation to +1 for maximum aggregation, dipped marginally until 2000 and then climbed continuously, while the contagion and cohesion indices traced similar consolidation trajectories. Growth initially followed the Hooghly River, producing an elongated urban spine, and later fanned out northward and along major transport corridors as central areas saturated.
The direction- and distance-wise breakdown adds critical nuance. Urban expansion now reaches up to 50 kilometres from the centre in the north-northeast direction, 45 kilometres in the north-northwest, and 35 kilometres in the south-southeast and west-southwest. The number of urban patches peaks first near the city centre and progressively later at greater buffer distances, indicating that central zones saturate sooner while peripheral zones continue generating new developments. In the north-northeast corridor—home to municipalities such as Barrackpore, Titagarh, Barasat, Madhyamgram, Kalyani, and Naihati—the analysis detected a distinctive two-peak fragmentation pattern, while the southwest fringe around Uluberia and the southeast around Rajpur-Sonarpur and Baruipur show their own fragmented growth signatures. Fragmentation was most intense in the 20 to 30 kilometre buffers, where split values in some directions were nearly 4,000 times greater than in the inner 5-kilometre ring. Shannon’s Entropy, used as an indicator of sprawl with values above 0.5 signalling dispersed growth, remained highest in the north-northeast and north-northwest directions and in the mid-peripheral buffers between 20 and 40 kilometres, confirming that sprawl is now essentially a peripheral phenomenon.
The policy implications are unambiguous. The authors argue that Kolkata’s trajectory illustrates the classic dynamics of unregulated sprawl: cheap fringe land, improved transport links encouraging long-distance commuting, rising living standards, and weak planning controls feeding a self-reinforcing loop of outward expansion. Their recommendations centre on compact development models—so-called new urbanism—in which housing, commerce, and public amenities are concentrated in walkable, human-scaled districts, supplemented by zoning, building permits, urban growth boundaries, tax incentives for cluster housing, and the redirection of public investment away from ecologically sensitive zones. The findings are explicitly tied to United Nations Sustainable Development Goal 11, on sustainable cities and communities, and the authors suggest that coupling the CA-Markov framework with agent-based or system dynamics models could better capture the socio-economic and institutional decision-making processes that ultimately shape urban form. They also acknowledge that future work should pay particular attention to the East Kolkata Wetlands, which merit a dedicated assessment given their ecological status. For planners across rapidly urbanizing Asia and Africa, the study offers both a methodological template and a sobering glimpse of what the coming half-century may hold if compact, sustainable growth fails to replace the sprawling pattern now etched into Kolkata’s landscape.
Cite Scienmag News
Courtney Benton. (September 4, 2026). Landscape metrics track Kolkata’s changing urban shape over time. Scienmag. https://scienmag.com/landscape-metrics-track-kolkatas-changing-urban-shape-over-time/
Courtney Benton. "Landscape metrics track Kolkata’s changing urban shape over time." Scienmag, 4 September 2026, https://scienmag.com/landscape-metrics-track-kolkatas-changing-urban-shape-over-time/. Accessed 4 September 2026.
Courtney Benton. "Landscape metrics track Kolkata’s changing urban shape over time." Scienmag. September 4, 2026. https://scienmag.com/landscape-metrics-track-kolkatas-changing-urban-shape-over-time/


