


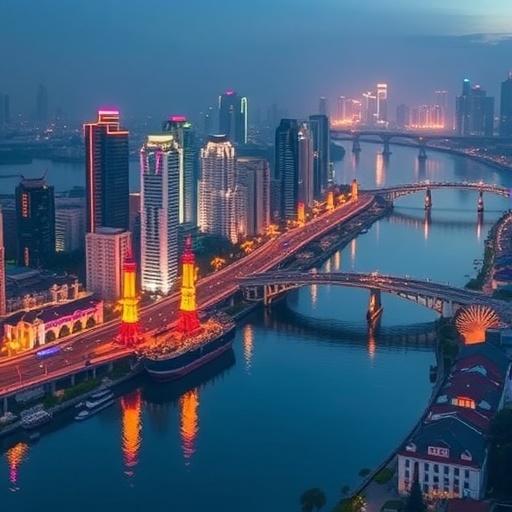
Wuhan, Chengdu, Nanjing, Suzhou and Xuzhou—some of the mightiest economic engines strung along China’s longest river—have spent the better part of a decade anchored near the bottom of the table when it comes to ecological resilience, according to a new open-access study published in Discover Sustainability on 30 August 2026. The research, carried out by a team at the China University of Geosciences in Wuhan and Hubei Three Gorges Polytechnic in Yichang, constructed a composite Urban Ecological Resilience Index for every prefecture-level and above city in the Yangtze River Economic Belt—108 cities in total—and tracked each of them year by year from 2014 to 2023. Its headline result is a paradox that cuts against the comfortable assumption that rich, well-equipped metropolises make the safest bets for environmental sustainability: while the basin-wide average crept upward over the decade, several of the region’s largest cities never escaped the lower tail of the distribution, and by 2023 the number of cities trapped in low-resilience spatial clusters had swollen to 62, while high-resilience clusters had withered to just four.
The Yangtze River Economic Belt is one of the most consequential urban-environmental experiments anywhere: a river-basin corridor in which ecological protection and high-quality economic development are meant to advance together, while dense industrialization, intensive agriculture, hydropower and some of the fastest urban expansion in the world place constant strain on soils, water and air. Urban ecological resilience—the capacity of a city’s ecological system to absorb disturbances, reorganize itself and keep delivering essential functions—has become the yardstick for judging whether that balancing act is actually succeeding. Measuring it honestly, however, is harder than praising it. As the authors note, the evidence base has been thin on three fronts: how resilience evolves across the full set of prefecture-level cities in the belt rather than a handful of showcase metropolises; how it differs between sub-regions of the vast basin; and whether major urban centers occupy genuinely resilient or quietly vulnerable positions in the basin-wide distribution. The new study was built to close all three gaps with a single decade of comparable, city-level data.
At the heart of the analysis sits the Pressure–State–Response framework, a long-standing architecture in environmental assessment that mirrors the causal chain linking human activity to environmental outcomes. Pressure indicators capture the burdens imposed on the urban ecosystem, typically pollution emissions, resource consumption and the conversion of land to intensive urban use. State indicators describe the resulting condition of the environment, from the extent of green coverage to the quality of water and air. Response indicators gauge how hard the city pushes back, through environmental investment, regulatory effort, afforestation and related countermeasures. Folding all three dimensions into one composite score allows a city’s overall ecological standing to be expressed as a single number that can be monitored over time and compared across space. In this study that composite is the Urban Ecological Resilience Index, or UERI, computed for each of the 108 cities in every year of the 2014–2023 window, giving the researchers a panel fine-grained enough to distinguish a city that is genuinely recovering from one that is merely spending its way to greener statistics.
Assembling the index demanded an objective way to weight its underlying indicators, and the team turned to the entropy weight method. In information theory, entropy quantifies the uncertainty, or variability, contained in a dataset; when adapted for composite-index construction, an indicator whose values differ sharply between cities carries more discriminating information and therefore earns a larger weight, while an indicator on which nearly all cities score alike is assigned a small one. This data-driven weighting suppresses the subjectivity that afflicts expert-assigned schemes and lets the indicators that most cleanly separate resilient from vulnerable cities dominate the final score. With a UERI value calculated for every city and year, the researchers then deployed four complementary instruments: descriptive statistics to chart the mean and spread of resilience across the basin; kernel density estimation to trace how the entire distribution of scores evolved; Dagum Gini coefficient decomposition to apportion overall inequality among its regional sources; and spatial autocorrelation analysis to test whether resilient and vulnerable cities cluster together on the map.
The temporal story opens with broad improvement and closes with a warning. The basin-wide mean UERI climbed from 0.4571 in 2014 to a peak of 0.5266 in 2020—an increase of roughly 15 percent in six years—before slipping back to 0.5120 in 2023. The post-2020 retreat is small in absolute terms but consequential for a ten-year trend: it implies that the momentum of the mid-2010s, when ecological red lines, pollution controls and green-development targets were being rolled out across the belt, has partially stalled. Because the index blends pressures, states and responses into one number, a dip can reflect any mixture of rising environmental burdens, deteriorating ecological conditions or weakening policy responses. The authors argue that identifying which ingredient drives the reversal requires opening up the composite itself, since an aggregate score can conceal as much as it reveals when its components move in opposite directions beneath a stable surface.
Convergence, by contrast, remained the dominant structural trend for most of the decade. The standard deviation of city-level UERI scores fell from 0.0851 in 2014 to 0.0531 in 2022, a contraction of nearly two-fifths indicating that lagging cities were closing the gap with the leaders faster than the leaders were extending it. In 2023 the dispersion rebounded slightly to 0.0558, hinting that the forces compressing differences across the belt may have begun to loosen just as average resilience slipped. Read together, the mean and dispersion trajectories sketch a basin that grew both more resilient and more equal through 2020, then drifted into mild regression on both fronts—a decade’s gains largely preserved but no longer expanding, and a small but persistent cohort of cities drifting away from the pack just as the pack itself had finally drawn together.
Kernel density estimation supplied the visual grammar for that story. The technique smooths the 108 city scores of any given year into a continuous probability curve, letting researchers see not merely the average but the whole anatomy of the distribution: whether it drifts rightward as cities improve, whether it sprouts multiple peaks that would signal a split into distinct high- and low-resilience camps, and whether fattening tails warn of cities falling far behind or racing far ahead. Comparing the curves year after year converts a table of 1,080 city-year scores into an evolving landscape, revealing where the mass of the basin sits and how that mass migrates through time. Distributional tools of this kind are increasingly favored in regional science precisely because averages can mask polarization: two basins with identical mean resilience can house radically different assortments of winners and losers, and only the shape of the density curve tells them apart.
The geography of resilience proved uneven in a subtler way than many observers might expect. Global Moran’s I—the standard statistic for spatial autocorrelation, spanning from −1 for a perfect checkerboard of dissimilar neighbors to +1 for perfectly matched ones—stayed positive and statistically significant but modest throughout the decade, rising from 0.082 in 2014 to 0.145 in 2019 before easing to 0.092 in 2023. Resilience, in other words, clusters only weakly: a city’s score is somewhat predictable from its neighbors’ scores but far from dictated by them. The local clustering picture was starker. Low–low clusters—contiguous groups of cities that all score low—remained the basin’s dominant spatial regime and expanded to 62 cities by 2023, while high–high clusters of mutually resilient neighbors contracted to four. The bulk of the Yangtze corridor thus sits inside low-resilience neighborhoods, and its islands of collective strength are both rare and shrinking, a configuration that complicates any policy premised on resilient cores radiating benefits outward.
To locate the sources of the inequality that remains, the study applied the Dagum Gini coefficient decomposition, a method that partitions overall disparity into three additive components: differences within regions, differences between regions, and transvariation density—the share of inequality generated when the distributions of different regions overlap, so that cities in one part of the basin outscore cities in another despite the regions’ nominal ordering. The verdict was unambiguous. Transvariation density contributed the largest average share of overall disparity, 35.06 percent, followed closely by inter-regional differences at 34.40 percent and intra-regional differences at 30.54 percent. A near-even tripartite split, led by the overlap term, carries a pointed policy message: narrowing the gap in the belt is not simply a matter of lifting a few lagging provinces, because the rankings themselves have become scrambled across regional boundaries—a positional mismatch in which geography and performance have drifted apart, leaving conventional region-by-region policy formulas aiming at the wrong targets.
The most arresting finding is the persistence of low resilience in the very cities that anchor the belt’s economy. Wuhan, Chengdu, Nanjing, Suzhou and Xuzhou stayed lodged in the lower tail of the distribution across the study period, a pattern the authors frame as persistent central-city vulnerability inside an otherwise improving basin. The mechanics are exactly what the PSR structure is designed to expose: megacities concentrate population, traffic, industrial output and land conversion, inflating the pressure side of the ledger faster than investment in greening and regulation can expand the response side, so their composite scores trail even as their budgets swell. The team argues that composite-index diagnosis of this kind can serve as a screening tool for policy, while flagging two directions for future research: digging into indicator-level mechanisms to pinpoint which specific pressures or weak responses drag the major cities down, and modeling hydrologically informed spatial connectivity, since cities along a river corridor are bound not only by contiguity on a map but by the movement of water, sediment and shared ecological fate along the Yangtze itself. The work, which received no specific external funding, is published open-access under a Creative Commons Attribution 4.0 license, with correspondence to Yilun He of Hubei Three Gorges Polytechnic in Yichang.
Cite Scienmag News
Violet Maxwell. (August 31, 2026). New PSR index gauges urban ecological resilience across Yangtze River cities. Scienmag. https://scienmag.com/new-psr-index-gauges-urban-ecological-resilience-across-yangtze-river-cities/
Violet Maxwell. "New PSR index gauges urban ecological resilience across Yangtze River cities." Scienmag, 31 August 2026, https://scienmag.com/new-psr-index-gauges-urban-ecological-resilience-across-yangtze-river-cities/. Accessed 31 August 2026.
Violet Maxwell. "New PSR index gauges urban ecological resilience across Yangtze River cities." Scienmag. August 31, 2026. https://scienmag.com/new-psr-index-gauges-urban-ecological-resilience-across-yangtze-river-cities/


