


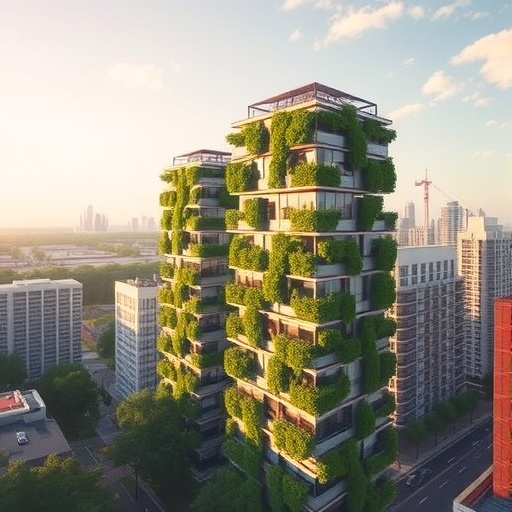
AI Scans Nearly a Million Walls to Find Where a City Can Beat the Heat With Green Façades
Summer after summer, the asphalt, brick, and concrete of modern cities are quietly cooking their residents. Because built surfaces absorb and re-emit far more heat than vegetated ground, urban districts run measurably hotter than their rural surroundings, driving up energy demand and eroding quality of life. Now researchers in Germany have unveiled an artificial intelligence pipeline that combs through three-dimensional city models and hundreds of thousands of street-level photographs to score every visible building wall on its suitability for vertical greenery—climbing-plant façades that cool buildings, trim electricity bills, and soften the urban heat island effect. Developed at the Center for Scalable Data Analytics and Artificial Intelligence (ScaDS.AI) Dresden/Leipzig and demonstrated on the city of Leipzig, the method turns a task that normally demands teams of surveyors and experts into an automated computation, handing urban planners something they have never had before: a data-driven, wall-by-wall ranking of where green infrastructure would deliver the greatest cooling return, the team reports in the journal Discover Cities.
The scientific case for green walls is well established. Foliage shades a wall from direct sun while the transpiration of water from leaves chills the surrounding microclimate; together these mechanisms lower indoor temperatures in summer and prevent excessive heat buildup, and in winter the plant layer adds insulation by curbing heat loss. The stakes are enormous. The International Energy Agency reported in 2018 that air conditioners and electric fans already accounted for nearly 20 percent of electricity consumption in buildings worldwide, while buildings as a whole consume roughly 40 percent of global energy. Vertical greenery systems come in several flavors: on direct green façades plants root directly in the wall itself, indirect façades use trellises and supports, and living walls grow in irrigated planter boxes that demand costly maintenance. The new study concentrates on green façades rooted in the ground or in containers at a building’s base—the simplest, most scalable option.
What has been missing is scale. Judging whether a single façade can carry vegetation is a multi-factor puzzle: planners must compute the solid wall area left after excluding windows and doors, weigh wall material and structural degradation, respect heritage protections, and assess solar orientation. A low window-to-wall ratio, for instance, signals fewer interruptions to prune around and therefore lower long-term maintenance costs—making a wall more attractive for large-scale greening. Consulting experts for every wall in a city is simply not feasible, and while earlier studies computed isolated variables such as solar radiation or façade orientation, no published method had integrated multiple relevant factors into a single suitability score, or fused geometric 3D building models with street-view imagery for the purpose. The Leipzig team set out to close that gap with a computational pipeline that ingests both data streams and outputs a ranked index of vertical greenery potential for individual walls.
The geometric foundation is Level of Detail 2 (LoD2) data—3D city models that describe buildings not as simple blocks, as the coarser LoD1 standard does, but with predefined roof shapes and distinct ground, wall, and roof surfaces, each stored as tuples of latitude, longitude, and height coordinates. For Leipzig, that meant roughly 155,000 buildings decomposed into approximately 921,500 individual wall surfaces. Before any analysis, the data required aggressive cleaning: surfaces with three or fewer coordinate points were discarded because they collapse into lines or points; walls with zero area were removed; and any wall whose normal vector deviated more than five centimeters up or down was classified as non-vertical and excluded. Because buildings are often modeled as clusters of parts—a main volume plus extensions and overhangs—a single physical wall can appear as many small surfaces, which would artificially depress its ground-bound status and apparent size. The pipeline therefore merges fragments belonging to the same wall, verifies ground-boundedness by counting coordinates that fall within ten centimeters of ground level, and applies computational geometry to subtract regions hidden behind neighboring structures, isolating each wall’s true outside-exposed surface.
The visual channel comes from 360-degree cameras mounted on vehicles that drove through Leipzig, with individual wall images extracted through an application programming interface; license restrictions from the imagery provider, Cyclomedia, prevent the pictures themselves from being published. The team pursued only walls the camera could reach within 25 meters and surfaces measuring at least 20 square meters. Crucially, the researchers refused to treat the photographs as raw snapshots. Using metadata returned with each image—focal length, camera position, yaw, pitch, and horizontal and vertical fields of view—they constructed a full camera calibration matrix holding the intrinsic parameters, combined with a joint rotation-translation matrix for the extrinsic ones, and projected the real-world three-dimensional coordinates of each wall’s bounding box onto the image plane. The OpenCV library then computed a transformation from the four projected corner points, warping each skewed façade into a rectified, front-facing view while preserving its aspect ratio and enforcing a 25-pixel margin against edge distortion. A MobileNet convolutional neural network, pretrained on ImageNet and fine-tuned for roughly five epochs, filtered out frames in which trees or vehicles blocked the view. About 105,000 façades—11.4 percent of all walls and 12.7 percent of outside-exposed ones—cleared every gate.
On the rectified images, a second convolutional neural network built on the detectron2 framework and trained to recognize windows, doors, and shopfronts went to work. Because the façade now faces the camera squarely, the pixel area of each detected box approximates its true surface area. The pipeline converts the wall’s LoD2 coordinates into pixel space to draw a polygon around the façade, subtracts the detected window and door boxes, and divides the remaining solid region by the total polygon area. The complement of that fraction is the window-to-wall ratio; multiplying it by the known outside surface area yields the solid wall area in square meters. These factors feed a deliberately simple composite index. Solid wall area receives the highest weight, 0.5, because greater area supports the biomass and foliage thickness that shading and evapotranspiration demand. Window-to-wall ratio takes 0.4, rewarding walls that will be cheap to maintain, while orientation takes 0.1, with south-facing walls scored highest for solar benefit. Skewed distributions were broadened using power transformations—an exponent of 0.3 for wall area and 0.5 for the inverted window ratio—before min–max normalization to a 0-to-1 scale.
To find out whether the automation could be trusted, the team manually annotated 50 randomly selected façades, labeling every visible window and door along with the façade boundaries. They deliberately benchmarked against a “detectable” window-to-wall ratio—the maximum information any single street image could provide—so the method would not be penalized for occlusions no camera could overcome, and they held the LoD2 surface area constant as the denominator for both manual and automated calculations to isolate detection performance. The results were largely reassuring: the window ratio tracked the identity line, with deviations traceable mostly to missed detections, and the solid wall area correlated strongly with ground truth, its residuals typically confined to a few square meters for standard buildings. Across the city, computed window-to-wall ratios mostly fell between 0.03 and 0.18, averaging 0.11. One systematic bias surfaced: LoD2 geometry overestimates façade area, showing a mean relative deviation of 16.73 percent and a median of 11.17 percent—a directional, stable error the authors argue can be calibrated out in future versions.
Scaled to the whole city, the numbers vindicate an ecological hunch first voiced in 2008, when researcher Manfred Köhler estimated that the wall area available for greening in inner cities is roughly twice the ground footprint of buildings. Leipzig’s LoD2 data puts the city’s ground surface area at about 26.3 million square meters and its solid wall area at about 51.2 million square meters—almost exactly the predicted two-to-one ratio, and a pointed reminder that façades offer more canvas for urban greenery than rooftops do. The orientation calculations revealed a striking periodicity as well: wall angles peak at 0, 90, 180, and 270 degrees from north, confirming that Leipzig’s streets and buildings align tightly with the cardinal directions. When the index was computed across all ranked walls, values clustered around 0.4, but restricting the analysis to walls of 40 to 160 square meters—the interquartile range typical of residential buildings—shifted the distribution up to between 0.5 and 0.6, and the highest-potential surfaces turned out to be large, windowless side façades that combine low maintenance costs with expansive area.
The team then stress-tested the index, varying each factor’s weight by plus or minus 20 percent. The maximum deviation in the final score was less than 0.025—evidence that the ranking is robust rather than an artifact of arbitrary weighting. Intriguingly, the window-to-wall ratio, despite its lower weight, swung the index more than solid wall area did, because its values vary far more widely across walls. The authors are equally candid about the limitations. Street-level imagery covered only about 11.5 percent of Leipzig’s walls, since rear façades, steep angles, and distant walls never appear before a vehicle-mounted lens. Very wide buildings forced wide-angle captures that shrank windows below the detection model’s reliable resolution, and because that model was trained exclusively on residential buildings, missed windows inflate the solid wall area and can exaggerate a wall’s apparent potential. The index also remains deliberately preliminary: heritage protection, structural integrity, plant species constraints, and shading by neighboring buildings are not yet modeled, and orientation is only a crude proxy for the solar radiation a wall actually receives.
Future iterations, the researchers suggest, could fold in oblique aerial imagery captured at 45 degrees from four directions, which would expose rear façades, minimize occlusion, and push coverage toward an entire city—something street-view collection alone cannot achieve. Vegetation detection could correct window-ratio estimates where trees mask façade elements, the systematic LoD2 overestimation could be subtracted as a calibration constant, and façade material, condition, and shadow dynamics could join the index. For now, the value lies in triage: the pipeline narrows a stock of nearly a million walls to a manageable, ranked shortlist that experts can verify on site, providing a quantitative baseline where previously there was none. The code is openly available on GitHub, the LoD2 models through Leipzig’s open data portal, and the work was funded through the ScaDS.AI center of excellence and the “Connected Urban Twins” project of the German Federal Ministry of the Interior. As heat waves lengthen and cooling costs climb, the study suggests that some of the cheapest climate infrastructure a city owns may already be standing in plain sight—its blank, sun-facing walls.
Cite Scienmag News
Celia A. (August 29, 2026). Automated Tool Maps Cities’ Potential for Vertical Greenery. Scienmag. https://scienmag.com/automated-tool-maps-cities-potential-for-vertical-greenery/
Celia A. "Automated Tool Maps Cities’ Potential for Vertical Greenery." Scienmag, 29 August 2026, https://scienmag.com/automated-tool-maps-cities-potential-for-vertical-greenery/. Accessed 29 August 2026.
Celia A. "Automated Tool Maps Cities’ Potential for Vertical Greenery." Scienmag. August 29, 2026. https://scienmag.com/automated-tool-maps-cities-potential-for-vertical-greenery/


