In a groundbreaking study published this year, researchers have embarked on a transformative journey to reshape how health inequality data is visualized, emphasizing clarity, accuracy, and accessibility. The article, appearing in the International Journal for Equity in Health, elucidates innovative approaches for selecting and designing graphical representations of health disparities, offering a vital toolkit for policymakers, researchers, and advocates alike. This contribution arrives at a crucial time when the world grapples with widening social and health inequities, urging a more nuanced understanding delivered through robust data visualization.
Drawing from interdisciplinary expertise, the authors dissect conventional methods and highlight the limitations that often obscure the narratives beneath vast datasets. Their work pivots on the core premise that the mode of data presentation can either illuminate or overshadow the realities of health inequality. By emphasizing tailored graph and map designs, they argue that visual tools must not only convey raw statistical differences but also embed context, scale, and sociological factors to be truly informative and impactful.
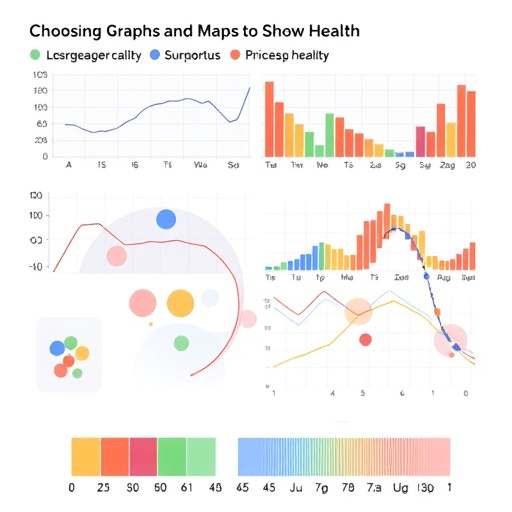
At the heart of this research lies a detailed critique of familiar visual formats such as bar charts, heat maps, and scatter plots. The authors scrutinize the efficacy of these tools in portraying complex multidimensional data typical of health studies, challenging the community to move beyond one-size-fits-all methodologies. Instead, they advocate for context-aware visualization strategies that consider audience literacy, the nature of inequality metrics, and the geographical or demographic specificity inherent in the data.
The study outlines an integrative framework for graph and map selection, interlacing statistical precision with visual cognition principles. Central to this framework is the balancing act between simplicity and depth—ensuring that viewers can extract meaningful insights without being overwhelmed by excessive detail or misled by oversimplification. For instance, the incorporation of graduated color schemes in maps is carefully calibrated to avoid the pitfalls of misinterpretation caused by uneven color scales or data clustering.
This research also dives into the realm of equity-focused policy communication, underlining how refined visuals can elevate advocacy and resource allocation decisions. Visual representations that clearly demarcate disparities—such as life expectancy, access to healthcare, or disease prevalence—strengthen arguments for addressing systemic inequities. The authors demonstrate that when health inequality data is presented with methodological rigor and visual appeal, it resonates more profoundly with stakeholders, fostering informed dialogue and action.
Technically, the paper provides exhaustive guidelines rooted in both data science and design thinking. It discusses the merits of various statistical measures, such as the Gini coefficient and concentration indices, in informing the construction of graphs. It stresses the significance of choosing appropriate baselines and normalization techniques, which critically affect data interpretation. These discussions are pivotal for avoiding common pitfalls like ecological fallacies or misrepresentations through aggregated data.
The visual toolkit recommended by the authors includes innovative hybrid models that meld maps with embedded charts, enabling simultaneous spatial and quantitative analysis. Such composite visuals harness the power of geographic information systems (GIS) combined with advanced graphical plotting, fostering deeper comprehension of localized inequalities. This is particularly beneficial for stakeholders aiming to identify hotspots or disparity gradients that might otherwise remain concealed.
Beyond technical guidance, the article acknowledges the ethical dimension of data visualization in health inequality research. By carefully selecting and designing visuals, researchers not only depict disparities but also embody respect for affected populations. The avoidance of stigmatizing imagery or misleading simplifications is emphasized, promoting transparency and cultural sensitivity in data dissemination. This ethical stance is increasingly recognized as fundamental in equity-centered research communication.
The interdisciplinary ethos of the work is reflective of modern health sciences, integrating epidemiology, visual analytics, sociology, and communication theory. The authors, drawing from a diverse range of case studies, show that the success of a visual representation depends on iterative testing with end-users, including policymakers and community advocates. Such participatory design processes are heralded as the future of impactful data visualization in public health.
Moreover, the article ventures into emerging digital technologies, considering possibilities offered by interactive dashboards and real-time visualizations. These platforms allow dynamic exploration of data subsets, empowering users to customize views according to specific research or policy questions. The authors foresee a future where static charts give way to engaging interfaces that democratize access to health inequality data globally.
The implications of this work extend beyond academia into practical realms of public health intervention and resource prioritization. By distilling complex datasets into comprehensible visuals, the framework fosters evidence-based decision-making. It equips stakeholders with the necessary clarity to design targeted programs addressing root causes of health disparities, thereby aligning with global commitments such as the Sustainable Development Goals.
Furthermore, the paper’s comprehensive recommendations serve as a vital educational resource for future generations of researchers. By standardizing visualization protocols, it encourages consistency across studies and facilitates cross-comparisons. This harmonization improves meta-analyses and synthesis reports, ultimately refining our collective understanding of social determinants of health.
Concluding their study, the authors stress the imperative for continuous innovation and adaptation in the visualization of health inequality data. As new datasets emerge—from genomics to social media signals—the tools and design principles must evolve accordingly. This adaptability ensures that health equity remains at the forefront of public discourse, supported by compelling and truthful visual narratives.
In essence, this research is a clarion call to the health community: visualization is not merely an aesthetic endeavor but a powerful instrument for justice and advocacy. By selecting and designing graphs and maps with precision, sensitivity, and creativity, we can amplify voices and stories hidden within numbers—taking a significant step toward a more equitable global health landscape.
Subject of Research: Visualization methods and design principles for health inequality data.
Article Title: Visualizing health inequality data: guidance for selecting and designing graphs and maps.
Article References:
Bergen, N., Kirkby, K., Nambiar, D. et al. Visualizing health inequality data: guidance for selecting and designing graphs and maps. Int J Equity Health 24, 343 (2025). https://doi.org/10.1186/s12939-025-02667-0
Image Credits: AI Generated
DOI: https://doi.org/10.1186/s12939-025-02667-0
