

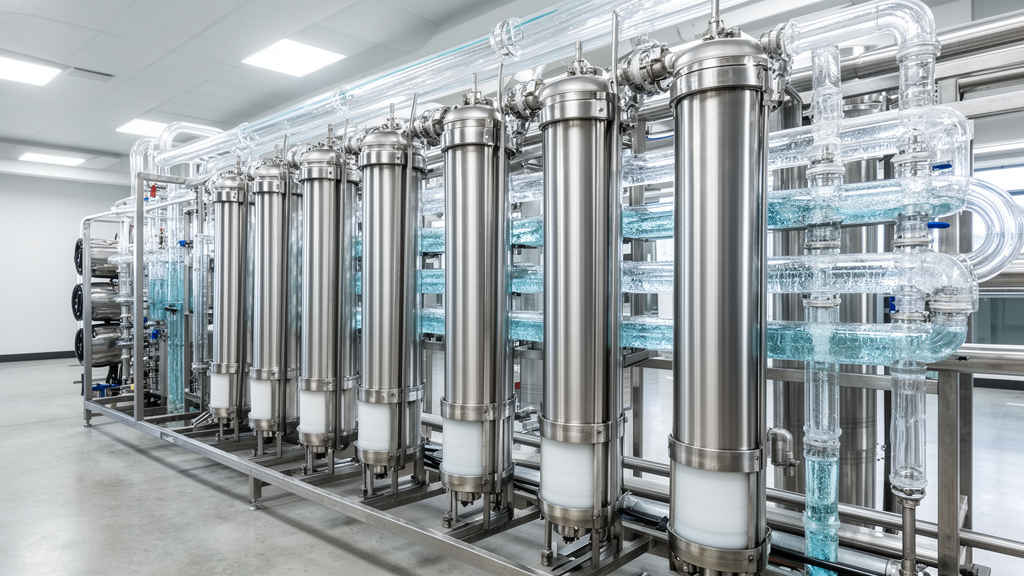
Researchers have developed a mathematical framework based on functional data analysis that simulates the complex cyclical behavior of membrane processes in water and wastewater treatment facilities. Modern water purification systems rely on cyclical operations, such as ultrafiltration membranes, membrane bioreactors, and closed-circuit reverse osmosis units, which undergo repeating production cycles separated by backwashes, chemical cleans, or tank refills. These operational cycles generate dense time-series measurements that exhibit pronounced nonstationarity, shifting variances, and baseline drift as membranes accumulate foulants over time. By treating individual filtration cycles as continuous functions, the data-driven simulation approach replicates both short-term cycle shapes and long-term evolutionary trends, providing water engineers with realistic synthetic datasets to benchmark autonomous fault detection algorithms and evaluate process integrity.
The simulation methodology decomposes observed non-faulty functional cycles into four distinct components: a global mean trend, a local mean trend, cycle-to-cycle variance, and within-cycle variance. The global mean trend accounts for gradual evolution in overall magnitude across a multi-day operational set, capturing systemic drift caused by irreversible membrane fouling that persists through routine physical backwashes until chemical cleaning resets baseline conditions. The framework also isolates two distinct types of variance that conventional analyses overlook. Cycle-to-cycle variance tracks how residual dispersion fluctuates over the runtime of an entire set, while within-cycle variance isolates position-dependent fluctuations occurring at specific elapsed times within each cycle. Standardizing observed cycles sequentially through these four layers extracts structural signatures, leaving behind uncorrelated residuals for stochastic reconstruction.
To transform discrete sensor readings into continuous functional curves, the framework utilizes cubic B-spline basis expansion paired with roughness penalties. Measurements are expressed as linear combinations of order-four polynomial basis functions defined over segmented subintervals separated by knots. Because placing knots at every observation point risks overfitting high-frequency measurement noise, the algorithm implements a curvature penalty weighted by a smoothing parameter, balancing fidelity against spurious oscillation. The optimal smoothing parameter is initially estimated through generalized cross-validation by iteratively omitting individual observations and calculating resulting squared prediction errors. However, because automated optimization can occasionally oversmooth sharp transitions or preserve excessive noise, the methodology incorporates visual calibration alongside specialized mathematical transformations. For operational regimes marked by abrupt variance drops, such as filtration immediately following backwash sequences, the algorithm smooths the natural logarithm of the variance before back-transforming it, avoiding numerical instability and boundary artifacts.
Once trend curves and variance profiles are extracted from baseline observations, the simulation engine generates synthetic datasets through a reverse reconstruction formula. The procedure begins by choosing the desired number of synthetic cycles and their runtime locations, followed by generating independent Gaussian white noise scaled to the empirical variance of the final standardized residuals. This simulated white noise is subsequently multiplied by the evaluated within-cycle standard deviation at each cycle time point and the cycle-to-cycle standard deviation evaluated at the corresponding set runtime. The algorithm then adds the estimated local mean trajectory for that cycle position before multiplying the cumulative quantity by the end-of-cycle global scaling factor. Because core functional parameters are pre-computed as smooth analytical functions, generating thousands of observations requires only seconds on a standard computer. The resulting synthetic time series preserve the nonstationary dispersion, cyclical geometry, and long-term degradation patterns of the physical process while introducing genuine stochastic variation.
The versatility of the simulation framework was initially validated using experimental data from an ultrafiltration pilot unit within a direct potable reuse mobile demonstration facility. Stationed at the Colorado School of Mines and treating effluent from the Aurora Wastewater Treatment Facility, the demonstration trailer incorporates six sequential advanced purification barriers: ozone treatment, biologically active filtration, ultrafiltration, granular activated carbon adsorption, ultraviolet irradiation, and chlorination. Automated supervisory control and data acquisition systems record trans-membrane pressure every ten seconds across repeated thirty-minute filtration cycles, each followed by a five-minute backwash. While reversible fouling is loosened and flushed during backwash intervals, residual particulate accumulation gradually induces irreversible fouling, generating baseline drift that requires chemical clean-in-place procedures to restore permeability.
Applying the simulation model to three independent ultrafiltration datasets operating under coagulant dosing durations of 7.5, 10, and 12.5 minutes reproduced trans-membrane pressure dynamics accurately. After excluding rare shortened cycles and standardizing cycle lengths to 29 minutes and 50 seconds, the global mean trend was determined by averaging trans-membrane pressure across the final ten points of each cycle, revealing quadratic upward curvature across multi-day runtimes. To capture local cycle geometry, the authors implemented a parametric equation that models an initial exponential pressure rise up to a transition breakpoint, beyond which trans-membrane pressure increases along a linear slope. Sequential two-stage least-squares optimization yielded robust parameter estimates across all cycles. Analysis of standardized residuals revealed a U-shaped cycle-to-cycle variance profile across runtime sets, reflecting initial instability before membrane ripening and elevated variance during late-stage irreversible fouling, while within-cycle variance exhibited an extreme initial peak before decaying toward a plateau.
A second demonstration evaluated the simulation framework against operational records from a sequencing batch membrane bioreactor treating municipal wastewater at the Mines Park apartment complex in Golden, Colorado. Operating with automated data acquisition logging trans-membrane pressure every five seconds, the facility screens raw influent through an onsite septic tank before transferring 325-gallon wastewater batches into dual sequencing batch reactors alternating on hourly biological nutrient removal cycles. Because the bioreactor executes hundreds of compact filtration cycles within an operational set, tracking trans-membrane pressure trajectories across successive cleaning cycles provides an essential metric for monitoring biological membrane integrity.
Modeling the sequencing batch membrane bioreactor data required specific algorithmic modifications to accommodate low sensor resolution and complex non-monotonic cycle shapes. Facility instrumentation recorded trans-membrane pressure with a coarse resolution of 0.1 units against maximum values near 2.6 units, creating stair-step records that obscured baseline trends and confined raw global drift between 2.45 and 2.60 units. Furthermore, individual filtration cycles exhibited an unusual double-inflection shape consisting of an initial steep pressure increase followed by a temporary plateau and a secondary increase between 30 and 50 seconds into the cycle. To capture this complex trajectory where parametric formulations proved impractical, the authors implemented a non-parametric cubic B-spline model averaged across all cycles, successfully tracing the secondary pressure rise across the 35-to-65-second window. A functional boxplot methodology eliminated abnormal outliers, and adjusting the within-cycle variance smoothing parameter captured the variance spike induced by variable secondary inflection timing.
The third experimental evaluation tested the framework on a closed-circuit reverse osmosis pilot system evaluating desalination membrane performance under synthetic brackish groundwater conditions. The pilot infrastructure featured a 0.5-micron cartridge prefilter, a commercial reverse osmosis membrane module, a positive displacement pump maintaining a constant permeate flux of 20 liters per square meter per hour, and a centrifugal booster pump recycling pressurized concentrate back into the primary feed stream. Closed-circuit operation recycles brine until dissolved solids reach a designated concentration threshold, causing mineral levels and osmotic pressure to increase continuously across cycles ranging from 15 minutes to two hours. To assess membrane integrity under changing salinity, researchers examined the mass transfer coefficient, defined as water flux multiplied by a temperature correction factor and divided by net driving pressure. The simulation framework designated normalized electrical conductivity across a zero-to-one domain as the primary functional axis rather than elapsed time, intrinsically accommodating nonlinear solute concentration rates.
Simulating closed-circuit reverse osmosis data required novel handling of unequal cycle durations, high-frequency instrument noise, and evolving functional shapes. High-frequency sensor noise was mitigated by binning observations into narrow windows of 0.05 milliSiemens per centimeter, while local mean trends were captured using a moving window averaging cubic B-splines fitted to ten preceding and ten succeeding cycles. To simulate sequences with realistic duration distributions, the algorithm probabilistically sampled cycle lengths and minimum conductivities from historical cycles located within temporal neighborhoods of set runtime. Cycle-to-cycle variance expanded toward the end of the set, while within-cycle variance plummeted past 0.1 normalized conductivity, requiring logarithmic smoothing to maintain stability. The four-part functional decomposition framework accurately reproduces diverse membrane processes without requiring prohibitive computational infrastructure. By delivering realistic synthetic data that captures both deterministic trends and nonstationary stochastic variance, this methodology provides a critical stepping stone toward developing digital twins and refining autonomous fault detection architectures across modern municipal water treatment networks.
Subject of Research: Simulating cyclical operational behavior and variance in membrane water treatment systems
Article Title: Simulating cyclical behavior in water and wastewater treatment processes
Article References: Privett, H. J., Cath, T. Y., & Hering, A. S. (2026). Simulating cyclical behavior in water and wastewater treatment processes. Discover Water, 6(1), Article 134. https://doi.org/10.1007/s43832-026-00428-w
Image Credits: AI Generated
DOI: 10.1007/s43832-026-00428-w
Keywords: functional data analysis, membrane processes, water treatment, wastewater treatment, ultrafiltration, membrane bioreactor, closed-circuit reverse osmosis, trans-membrane pressure, mass transfer coefficient, cubic B-splines, irreversible fouling, backwashing, fault detection, synthetic data generation, nonstationarity, coagulant dosing, digital twins, generalized cross validation
Cite Scienmag News
Violet Maxwell. (November 12, 2026). Functional Data Analysis Successfully Simulates Cyclical Membrane Water Treatment Dynamics. Scienmag. https://scienmag.com/functional-data-analysis-successfully-simulates-cyclical-membrane-water-treatment-dynamics/
Violet Maxwell. "Functional Data Analysis Successfully Simulates Cyclical Membrane Water Treatment Dynamics." Scienmag, 12 November 2026, https://scienmag.com/functional-data-analysis-successfully-simulates-cyclical-membrane-water-treatment-dynamics/. Accessed 12 November 2026.
Violet Maxwell. "Functional Data Analysis Successfully Simulates Cyclical Membrane Water Treatment Dynamics." Scienmag. November 12, 2026. https://scienmag.com/functional-data-analysis-successfully-simulates-cyclical-membrane-water-treatment-dynamics/