


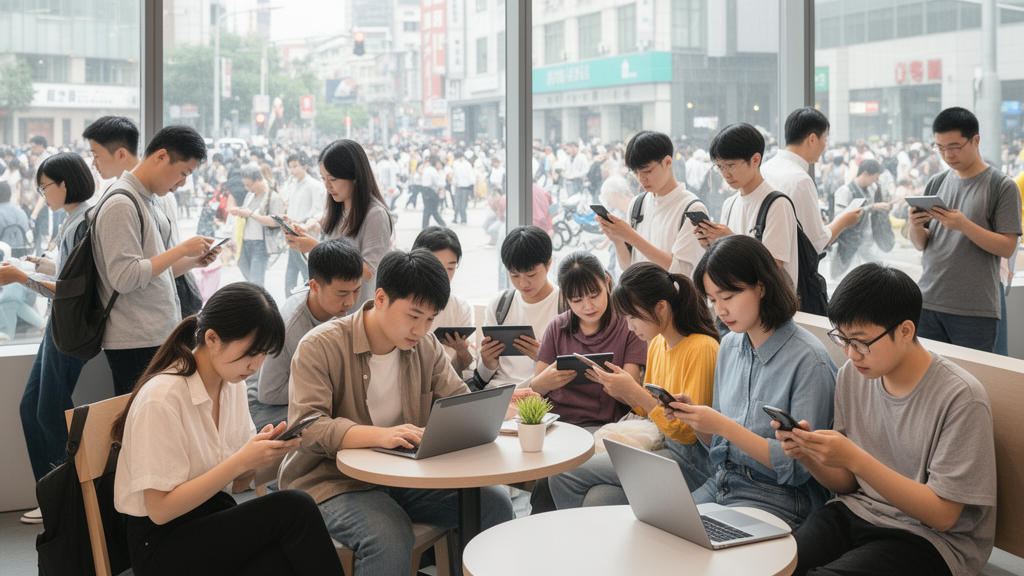
A repeated cross-sectional analysis of nine Chinese General Social Survey waves found that the label “nonfrequent internet user” referred to a markedly different population in 2023 than in 2010, even as frequent internet use grew from 19.15% to 71.73% of surveyed adults. The study included 90,457 records for descriptive analyses of people aged 18 or older and 71,218 records for association analyses among adults aged 30–74. It also found positive but variable differences in leisure exercise between frequent and nonfrequent users. Because the surveys repeatedly sampled different respondents rather than following the same people, the results describe population-level associations and cannot establish that internet use caused changes in exercise.
The changing composition was visible not only in the growth of frequent use but in the internal mixture of people classified as nonfrequent. In 2010, 82.82% of nonfrequent users reported never using the internet, compared with 8.38% who used it rarely and 8.80% sometimes. By 2023, the never-use share had fallen to 48.88%, while rarely and sometimes users accounted for 22.97% and 28.15%, respectively. Frequent users also became more concentrated at the highest reported frequency: the always or very frequent response represented 45.86% of frequent users in 2010 and 64.01% in 2023. Thus, a binary comparison between frequent and nonfrequent use did not necessarily compare the same mixture of behaviors from one wave to the next.
The social profiles of the frequency categories also changed. Weighted mean age among nonfrequent users rose from 49.35 years in 2010 to 62.39 in 2023, compared with increases from 33.89 to 43.31 among frequent users and from 46.39 to 48.71 in the full adult sample. The mean age of never users increased from 51.51 to 67.72, while low-frequency users had mean ages of 38.91 and 57.30 in the two endpoint surveys. The age gap between never and frequent users widened from 17.62 to 24.41 years. These endpoint patterns do not track individual aging because each survey is independent, but they show that nonfrequent use became increasingly concentrated among older respondents.
Other dimensions of composition did not move in a single direction. Nonfrequent users had lower mean personal-income percentiles than frequent users in both endpoint years, but their relative disadvantage grew: the nonfrequent-user average fell from 45.75 to 37.62, while the frequent-user average declined from 69.68 to 54.89. The share of nonfrequent users with tertiary education fell from 5.11% to 3.93%, and the corresponding figure for frequent users fell from 49.59% to 29.85%, indicating that frequent use spread across educational backgrounds. Agricultural hukou, a marker of rural registration status in China, accounted for 74.80% of nonfrequent users in 2023, compared with 62.35% of frequent users and 65.87% of the overall adult population. Composition therefore differed by age, education, registration status and income rather than conforming to a single profile of disadvantage.
For the exercise analysis, researchers fitted survey-weighted logistic models separately for each survey year. They standardized predicted exercise probabilities to that year’s respondents aged 30–74, retaining each respondent’s age, education, sex, ethnicity, hukou and province while changing internet-use frequency in the model. The main adjustment used a natural spline for age and also accounted for sex, Han versus other ethnicity, five education categories, agricultural versus other hukou and province. Leisure exercise was defined as exercising daily or several times per week during the previous year; the questionnaire did not include a separate once-per-week response. The resulting contrasts are model-based differences for a common population within each year, not direct differences between the observed exercise percentages of the groups.
All nine frequent-minus-nonfrequent point estimates favored more frequent internet use, ranging from 2.12 percentage points in 2010 to 10.09 points in 2017. The intervals were compatible with no difference in 2010 and 2023, when estimates were 2.12 and 5.16 points, respectively, while those for the other seven years excluded zero. The 2017 estimate was accompanied by a 95% confidence interval of 7.81 to 12.38 percentage points. An auxiliary summary that gave each survey equal weight produced an average standardized difference of 5.99 percentage points. These values describe cross-sectional associations whose size and uncertainty varied across years; they do not demonstrate a steady strengthening relationship or a causal effect of internet use.
Separating the broader nonfrequent group clarified the pattern. The standardized difference between frequent and never users ranged from 4.29 percentage points in 2010 to 13.65 in 2017, with confidence intervals excluding zero in every wave. By contrast, frequent-minus-low-frequency differences ranged from −0.19 points in 2010 to 7.07 in 2017, and seven of the nine intervals included zero. The five response categories did not show exercise probabilities increasing consistently with internet frequency: for example, the highest-frequency group had a lower standardized exercise probability than the often-use group in 2011 but a higher one in 2023. The combined binary estimate therefore merged distinct comparisons among people with different levels and types of internet use.
Standardization cannot overcome missing support at the boundaries of the data. In the 2023 association sample, respondents aged 30–35 represented 14.43% of the weighted target population, yet no one in that age group was a never user. Estimating never-user exercise for the full target therefore required extrapolation. Other gaps included never users aged below 31 in the 2021 target and frequent users aged above 73 in 2011. Joint classification by age, sex, education and hukou revealed additional combinations absent from particular use groups, including 37.25% of the weighted 2023 population in combinations with no never-user records. Although all 18 three- and five-category models converged with full-rank matrices, successful model fitting did not guarantee that every prediction rested on observed respondents.
Sensitivity analyses showed how strongly the binary association depended on measured social characteristics. In an identical sample of 64,000 respondents with complete extended data, the unadjusted average difference was 12.66 percentage points. It fell to 5.98 points after core adjustment and to 5.31 after adding marital status, employment and household-income rank. Restricting the main sample to those complete records changed the core-adjusted estimate by only 0.01 percentage point, so the larger reduction came from additional adjustment rather than sample restriction. Multiple-imputation analyses with extended adjustment produced an average difference of 5.38 points, and adding self-rated health yielded 5.14 points. These results are consistent with shared age, educational, economic and household circumstances influencing both internet use and leisure exercise.
Important limitations prevent the findings from being read as evidence that frequent internet use encourages exercise or that internet adoption caused the changing social composition. The internet item measured frequency but not purpose, duration, skills or benefits, and the exercise measure did not capture intensity or total physical activity. Survey wording and device examples varied over time, raising questions about measurement consistency. Repeated cross-sections and self-reported outcomes cannot separate causation from health selection, individual adoption, cohort replacement or period effects, and they cannot track changes in the same individuals. Province was used as a proxy for geographic clustering because the official sampling units and strata were unavailable across releases, while changing weights and geographic coverage complicated some short-term comparisons. The study’s clearest conclusion is methodological but consequential: as internet use diffused through Chinese society, the same frequency categories came to represent different people, so exercise associations should be reported with their composition, standardization population and observed coverage rather than treated as stable comparisons.
Subject of Research: Changes in the social composition of Chinese internet-use groups and their associations with leisure exercise across nine survey waves
Article Title: Changing social composition of internet-use frequency categories and leisure exercise in China: a repeated cross-sectional study
Article References: Zhu, W., Lin, Y., Hong, B., & Liu, J. (2026). Changing social composition of internet-use frequency categories and leisure exercise in China: a repeated cross-sectional study. Frontiers in Public Health, 14, Article 1965960. https://doi.org/10.3389/fpubh.2026.1965960
Image Credits: AI Generated
DOI: 10.3389/fpubh.2026.1965960
Keywords: China, internet use, digital inequality, leisure exercise, social composition, repeated cross-sectional surveys, physical activity, survey weighting, standardization, Changing, social, composition
Cite Scienmag News
Ophelia Keating. (October 26, 2026). China’s internet users changed as frequent use became the norm. Scienmag. https://scienmag.com/chinas-internet-users-changed-as-frequent-use-became-the-norm/
Ophelia Keating. "China’s internet users changed as frequent use became the norm." Scienmag, 26 October 2026, https://scienmag.com/chinas-internet-users-changed-as-frequent-use-became-the-norm/. Accessed 26 October 2026.
Ophelia Keating. "China’s internet users changed as frequent use became the norm." Scienmag. October 26, 2026. https://scienmag.com/chinas-internet-users-changed-as-frequent-use-became-the-norm/


