


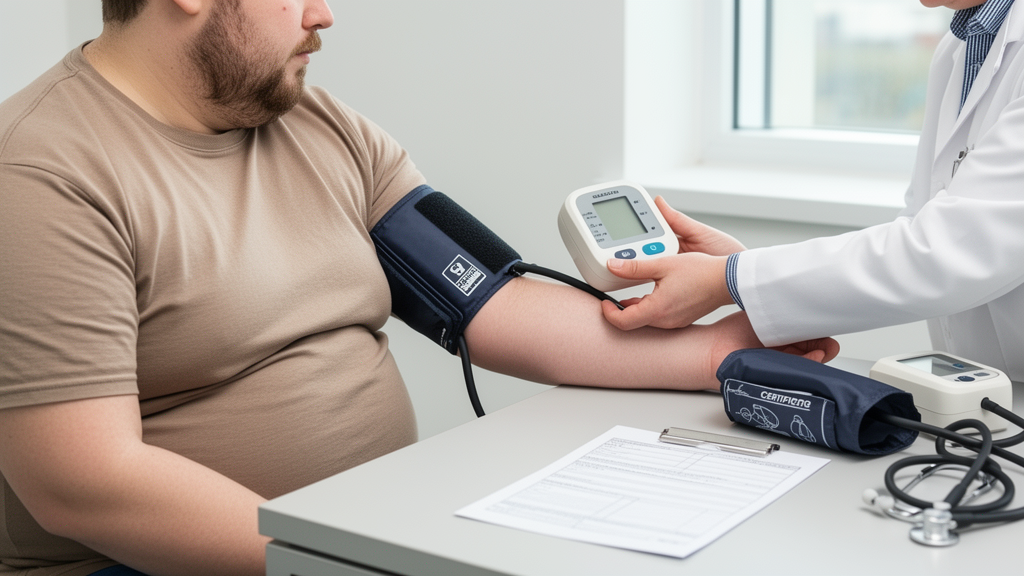
A large retrospective analysis of occupational health records found that higher body mass index was associated with higher blood pressure, a greater share of selected cardiometabolic diagnoses, and shorter periods before occupational medicine certificates required reassessment. In the POLOCARIA study, mean systolic blood pressure rose from 121.65 mmHg among people classified as normal weight to 141.01 mmHg among those with Class III obesity, while mean certificate validity fell from 34.81 months to 27.80 months across the same BMI categories. The analysis covered 988,822 patient-year records from 620,882 patients attending a large private healthcare network in Poland between January 2016 and December 2025.
Researchers examined routinely collected occupational-health data using chi-square tests, one-way analysis of variance, Spearman correlations and linear regression with standard errors clustered by patient identifier. The patient-year was the unit of analysis, meaning that 221,985 patients, or 35.8% of the 620,882 individuals, contributed records in more than one calendar year. The investigators studied relationships between BMI, age, sex, smoking status, province of residence, blood pressure, heart rate, selected ICD-10 diagnoses and the number of months for which an occupational medicine certificate remained valid. Analyses used available observations without imputation, and variable-specific denominators varied substantially across the dataset.
BMI was available for 933,929 patient-year records and was categorized for 909,565 records. Researchers classified adults according to the World Health Organization BMI ranges: underweight below 18.5 kg/m², normal weight from 18.5 to below 25.0 kg/m², overweight from 25.0 to below 30.0 kg/m², and Classes I, II and III obesity beginning at 30.0, 35.0 and 40.0 kg/m², respectively. A selected diagnostic category was recorded for 517,386 patient-year records, while 473,335 contained both a diagnostic category and BMI category. Certificate validity was available for 984,321 records, systolic blood pressure for 959,157, and heart rate for 834,678.
The composition of recorded diagnoses differed across BMI categories. Diabetes or hyperglycaemia diagnoses, represented by ICD-10 codes E10 and R73, accounted for 8.2% of selected diagnoses among people of normal weight, 15.0% among those who were overweight, 18.7% in Class I obesity, 20.4% in Class II obesity and 20.8% in Class III obesity. Gout diagnoses rose from 0.7% at normal weight to 3.1% in overweight and 6.1% in both Classes II and III. Cardiovascular or thromboembolic diagnoses increased from 2.7% at normal weight to 5.9% among those who were overweight, peaking at 6.8% in Class I obesity. These figures describe the mix of selected diagnoses recorded within each BMI group, not the prevalence of disease in the underlying population.
That distinction is central to interpreting the results. Each patient-year had one recorded diagnosis, and a diagnosis was available for only 52.3% of records. Consequently, the percentages cannot establish that more people in a given BMI category had diabetes, gout or cardiovascular disease; they show that such diagnoses occupied a larger share of the diagnoses selected and recorded for that category. The authors also warned against interpreting the smaller share of depressive and anxiety diagnoses at higher BMI as evidence that mental disorders were less common. The share fell from 18.0% at normal weight to 12.2% in overweight and approximately 9% to 10% in the obesity categories, but the pattern may reflect a greater relative representation of somatic diagnoses within the selected recording field rather than any change in the occurrence of mental illness.
Blood pressure showed a clear gradient across BMI categories. Mean systolic pressure was 121.65 mmHg at normal weight, 130.10 mmHg in the overweight group, 134.69 mmHg in Class I obesity, 137.89 mmHg in Class II obesity and 141.01 mmHg in Class III obesity, a difference of 19.36 mmHg between normal weight and Class III obesity. Mean diastolic pressure increased from 76.07 to 84.56 mmHg over the same range. Analysis of variance identified differences by BMI category for systolic pressure, diastolic pressure, heart rate and certificate validity, although effect sizes were larger for the blood-pressure measures than for certificate validity. In correlation analysis, BMI was positively associated with systolic pressure at ρ = 0.401 and diastolic pressure at ρ = 0.347, while its association with heart rate was weaker at ρ = 0.087.
Certificate validity also declined as BMI rose. The mean interval was 34.81 months for normal-weight records, 31.14 months for overweight records, 29.02 months in Class I obesity, 28.31 months in Class II obesity and 27.80 months in Class III obesity. Overall, BMI was negatively correlated with certificate validity at ρ = −0.172. The 7.01-month difference between normal weight and Class III obesity appears substantial in descriptive terms, but the analysis of variance effect size for differences in certificate validity across all BMI categories was η² = 0.024, indicating that BMI category accounted for only a small share of variation in this administrative interval.
In regression models, age category, systolic blood pressure and BMI together explained 9.7% of the variance in certificate validity. Age category had the largest standardized association with a shorter interval at β = −0.209, followed by systolic blood pressure at β = −0.148 and BMI at β = −0.053. The BMI estimate had a 95% confidence interval of −0.055 to −0.050, so the adjusted association remained statistically detectable in the very large dataset but was modest. Negative BMI associations with certificate validity were also reported within records containing cardiovascular or thromboembolic, diabetes or hyperglycaemia, depressive or anxiety, selected dermatological and gout diagnoses. The models were not adjusted for job characteristics, occupational exposures, examination type, smoking status, sex or calendar year, leaving several clinical, occupational and regulatory influences unmeasured.
Annual patterns in the network were also described. The proportion of patient-year records classified as normal weight decreased from 46.0% in 2016 to 39.1% in 2025, while the overweight share rose from 33.9% to 35.3% and the combined share in Classes I to III obesity increased from 17.5% to 23.2%. Average certificate validity rose in 2021, peaked in 2022 and then declined through 2025; among records with sex information, mean validity was longer for women than men in every year. These are annual distributions within the participating network, not estimates of population prevalence or direct evidence that the national workforce underwent corresponding changes.
The study offers evidence that occupational examinations can reveal clinically recognizable patterns in routinely collected data, but its retrospective design prevents causal conclusions. Data came from one private healthcare network and may not represent all Polish occupational health providers or the entire working-age population. Repeated observations were handled through patient-clustered standard errors in the regression models, but the chi-square, analysis of variance and correlation analyses did not account for clustering and should be regarded as descriptive. BMI also fails to describe body composition or fat distribution, and certificate duration may depend on the examination context, job demands, exposures, physician judgment and regulatory standards. The interval to reassessment is therefore not a direct measure of work ability, job-specific fitness, disease severity or prognosis, nor evidence that BMI itself caused certificates to be issued for shorter periods. The findings instead identify cardiometabolic risk signals within occupational records that may prompt appropriate clinical follow-up, rather than a stand-alone basis for judging an individual worker’s fitness.
Subject of Research: Associations between BMI, recorded diagnoses, blood pressure and occupational medicine certificate validity in Polish workers’ health records
Article Title: BMI category, recorded diagnosis composition, and occupational medicine certificate validity: the POLOCARIA study, 2016–2025
Article References: Poboży, M., Rulkiewicz, A., Lisik, W., Stojčev, Z., Filipiak-Rokicka, E., Pilchowska, I., & Domienik-Karłowicz, J. (2026). BMI category, recorded diagnosis composition, and occupational medicine certificate validity: the POLOCARIA study, 2016–2025. Frontiers in Public Health, 14, Article 1920503. https://doi.org/10.3389/fpubh.2026.1920503
Image Credits: AI Generated
DOI: 10.3389/fpubh.2026.1920503
Keywords: body mass index, occupational health, blood pressure, cardiometabolic risk, diabetes, obesity, medical certificates, real-world data, Poland, category, recorded, diagnosis
Cite Scienmag News
Ophelia Keating. (October 25, 2026). Higher BMI linked to blood pressure and shorter occupational certificates. Scienmag. https://scienmag.com/higher-bmi-linked-to-blood-pressure-and-shorter-occupational-certificates/
Ophelia Keating. "Higher BMI linked to blood pressure and shorter occupational certificates." Scienmag, 25 October 2026, https://scienmag.com/higher-bmi-linked-to-blood-pressure-and-shorter-occupational-certificates/. Accessed 25 October 2026.
Ophelia Keating. "Higher BMI linked to blood pressure and shorter occupational certificates." Scienmag. October 25, 2026. https://scienmag.com/higher-bmi-linked-to-blood-pressure-and-shorter-occupational-certificates/


